FIGURE 6.

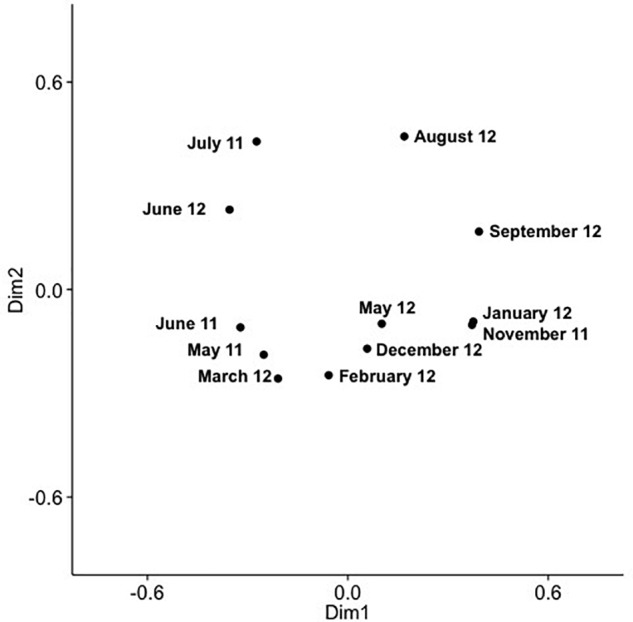
PCoA of SAA cyanomyovirus communities in samples from the surface layer; the PCoA is based on relative OTU abundances. Communities were rarefied; labels indicate sampling month and year.

PCoA of SAA cyanomyovirus communities in samples from the surface layer; the PCoA is based on relative OTU abundances. Communities were rarefied; labels indicate sampling month and year.