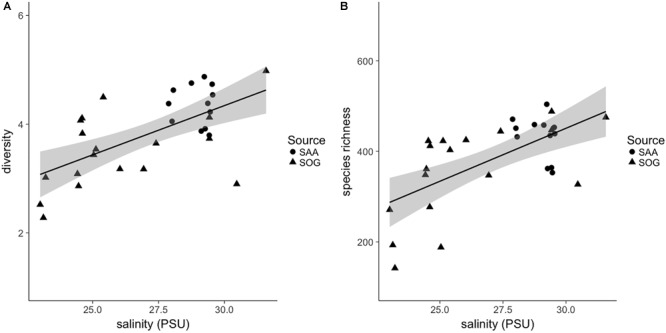
FIGURE 8.

(A) Shannon alpha diversity and (B) species richness of combined samples in relation to salinity. Sample source is indicated as follows: SOG (solid triangles) and SAA 10 m (solid circles). For the linear regression, gray shading is the 95% confidence interval. For the diversity and richness correlations R2 and significance (p)-values are 0.38 and 0.39, respectively, and p = < 0.001 for both.
