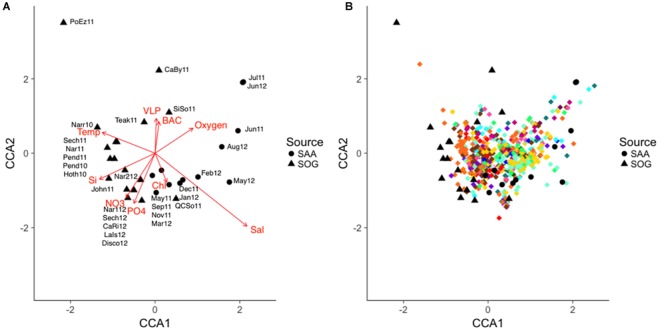
FIGURE 9.

(A,B) CCA of the combined SOG and SAA 10 m cyanomyovirus communities. SAA samples are shown as solid circles and SOG samples as solid triangles, OTUs are shown as diamonds with colors corresponding to the phylogenetic clades in Figure 3. The direction and strength of the constraining environmental variables are shown in red. SOG labels: CaBy, Carrington Bay; CaRi, Campell River; Disco, Discovery Passage; Hoth, Hotham Sound; John, Johnston Strait; LaIs, Lasqueti Island; Narr, Narrows Inlet; Pend, Pendrell Sound; PoEz, Port Elizabeth; Sech, Sechelt Inlet; SiSo, Somoon Sound; Teak, Teakern Arm; QCSo, Queen Charlotte Sound. SAA labels denote sampling month and year.
