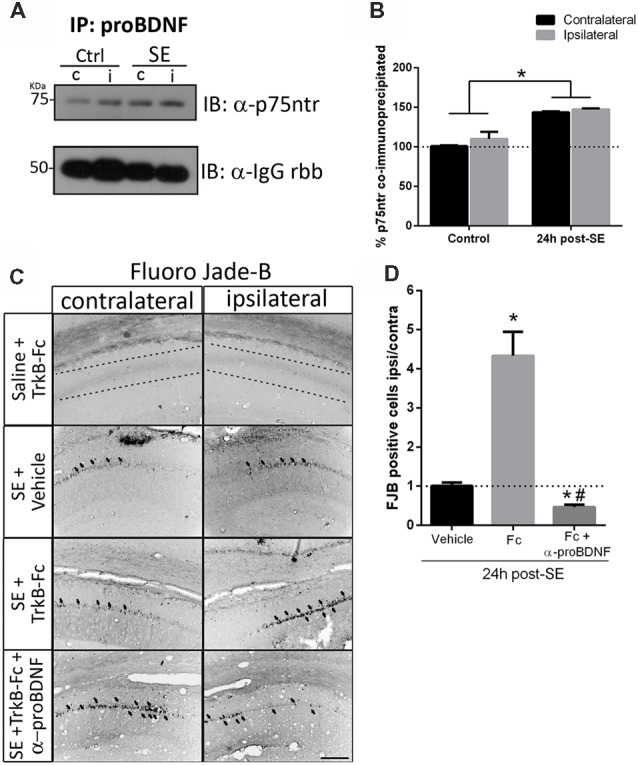
Figure 6.

Blockage of proBDNF prevents neuronal death even when BDNF is sequestered. (A) Representative immunoblot showing p75NTR co-immunoprecipitated with proBDNF in the non-infused side (c) and infused side (i) in control and SE animals, and quantification (B). Mean ± SEM are indicated. Protein levels were quantified in three animals per group. Asterisks indicate p < 0.05 compared to control contralateral by two-way ANOVA followed by Tukey’s post hoc analysis. (C) Micrographs of hippocampal CA1 stained with FJB show representative animals from each treatment, and quantification (D). Results are expressed as mean and SEM of three to five animals per treatment. Asterisks indicate p < 0.05 compared to vehicle by nested ANOVA followed by Tuckey’s post hoc analysis. Hashtag indicate p < 0.05 compared to TrkB-Fc by nested ANOVA followed by Tukey’s post hoc analysis. Scale bar = 200 μm.
