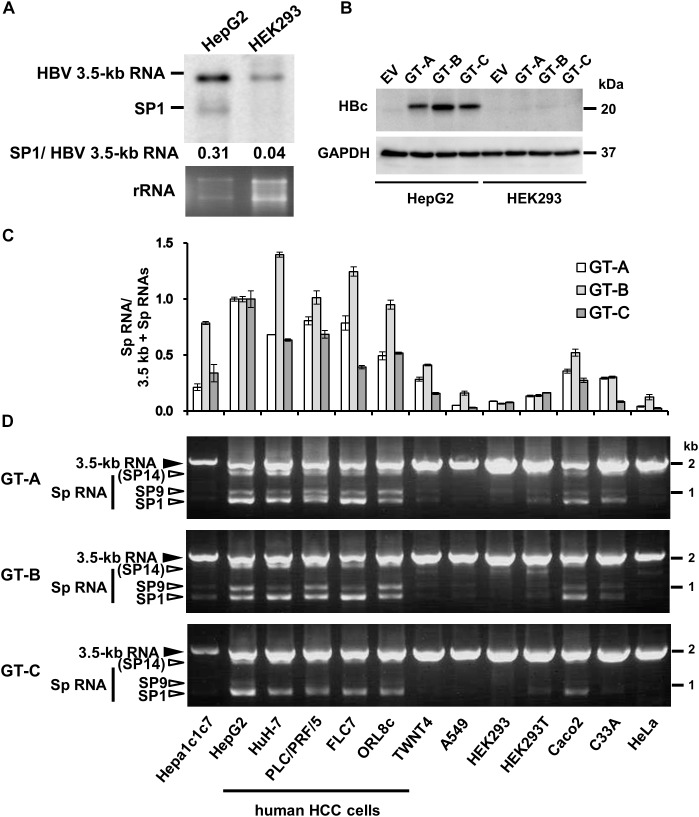
FIGURE 1.
Cell-type dependency of HBV 3.5 kb RNA splicing. (A) pUC-HB-Ce was transfected into HepG2 and HEK293 cells. Two days after the transfection, total RNA was extracted from cells and separated on an agarose gel. HBV 3.5 kb RNA and spliced RNA(s) were detected by northern blotting using HBV RNA probe (nt 1998–2447) (Supplementary Figure S1A). Band intensities of 3.5 kb- and SP1 RNAs on the blot were determined by ImageJ software and the ratios of SP1 RNA to 3.5 kb RNA calculated were indicated. Ethidium bromide-stained agarose gel electrophoresis of 18S ribosomal RNA (rRNA) was also shown (bottom). (B) HepG2 and HEK293 cells transfected with pUC-HB-Ae (GT-A), -Bj56 (GT-B), -Ce (GT-C) and an empty vector (EV) were analyzed by immunoblotting to detect HBcAg and glyceraldehyde-3-phosphate dehydrogenase (GAPDH). (C) qRT-PCR analysis was performed to determine the levels of 3.5 kb RNA and spliced RNA in 13 kinds of cells transfected with pUC-HB-Ae (GT-A), -Bj56 (GT-B), and -Ce (GT-C). The quantity ratios of the spliced RNAs to total 3.5 kb RNA derived RNA species were calculated and those in HepG2 cells were set to 1. Values shown represent means ± SD obtained from three independent samples. (D) Total RNAs obtained from the cell samples as shown in (C) were used with semi-quantitative RT-PCR. cDNA bands corresponding to unspliced 3.5 kb RNA and its spliced forms (Sp RNA) were detected by agarose gel electrophoresis. Unspliced 3.5 kb RNA, SP9, and SP1 were identified by nucleotide sequencing. SP14 was estimated from the size of PCR product obtained. Cell lines used were indicated at the bottom.

