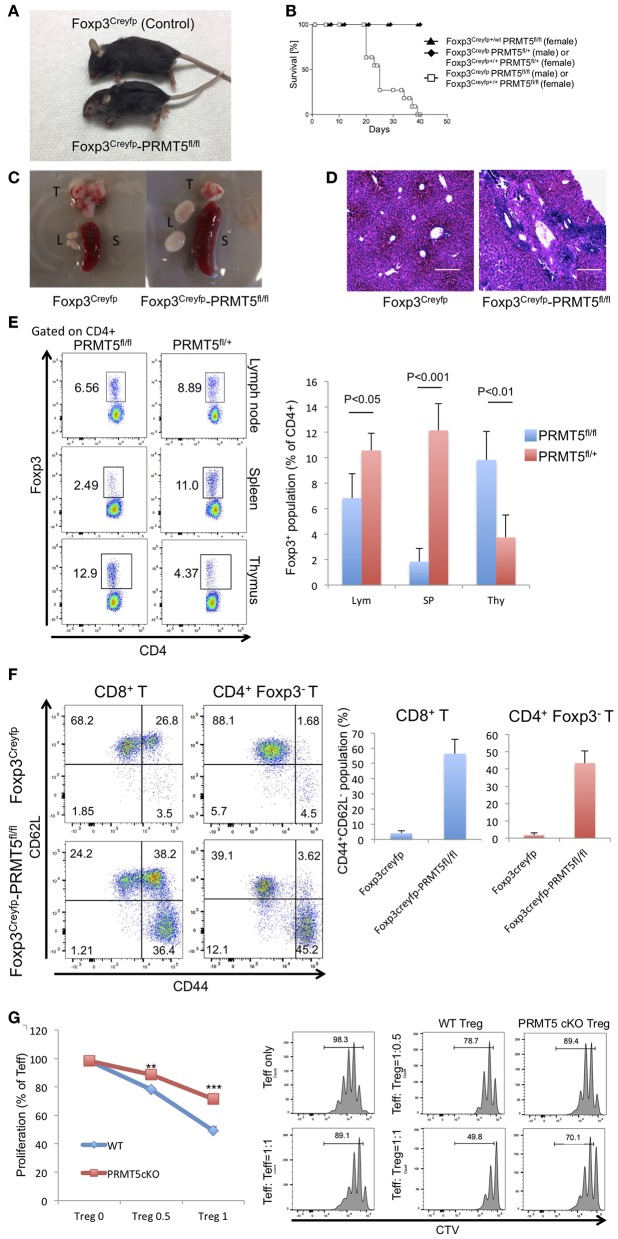
Figure 2.
Foxp3Creyfp-PRMT5fl/fl mice display scurfy-like symptoms. (A) phenotype of Foxp3Creyfp-PRMT5fl/fl mouse (male, 18–21 days old). (B) survival curve of Foxp3Creyfp-PRMT5fl/fl mouse (10 mice). (C) spleen (S), thymus (T), and lymph nodes (L) from Foxp3Creyfp and Foxp3Creyfp-PRMT5fl/fl mouse. (D) H&E staining of liver sections from Foxp3Creyfp and Foxp3Creyfp-PRMT5fl/fl mouse. Bar = 200 μm. Data shows a representative of 3 different mice. (E) Treg populations of spleen, lymph node and thymus from Foxp3Creyfp and Foxp3Creyfp-PRMT5fl/fl mouse Data shows a representative of 4 different mice. (F) activation of T cells in Foxp3Creyfp-PRMT5fl/fl mice. TCRβ+ T cells from Foxp3Creyfp and Foxp3Creyfp-PRMT5fl/fl mouse lymph nodes (axillary and inguinal) were stained with anti-CD44 and CD62L antibodies, and analyzed by flow cytometry. Data shows a representative of 4 different mice. (G) suppressive functions of lymph node Tregs from Foxp3Creyfp (WT) and Foxp3Creyfp-PRMT5fl/fl (Prmt5 cKO) mouse. The error bars indicate the SD value. **P < 0.005, ***P < 0.001 with Foxp3Creyfp groups calculated by student t-test.

