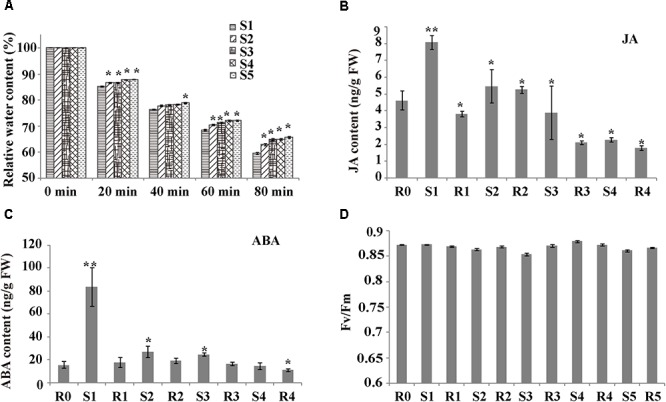
Figure 1.

Plant response parameters during drought training treatment. (A) Relative water content (RWC) of the sampled leaves, after air drying for the indicated times. Values are the mean ± SD (n = 10). Within each water treatment, asterisks indicate significant differences by Tukey LSD test (∗P < 0.05). (B) Hormone levels during drought treatment. Levels of JA were measured at the indicated times. Values are the mean ± SD (n = 5). Within each water treatment, asterisks indicate significant differences by Tukey LSD test (∗P < 0.05, ∗∗P < 0.01). (C) Hormone levels during drought treatment. Levels of abscisic acid (ABA) were measured at the indicated times. Values are the mean ± SD (n = 5). Within each water treatment, asterisks indicate significant differences by Tukey LSD test (∗P < 0.05, ∗∗P < 0.01). (D) Photosynthesis rate of plants exposed to stress cycles during the initial watered (W) state and on recovery (R1–R5) from one or more stresses. Values are the mean ± SD (n = 10).
