Figure 2.

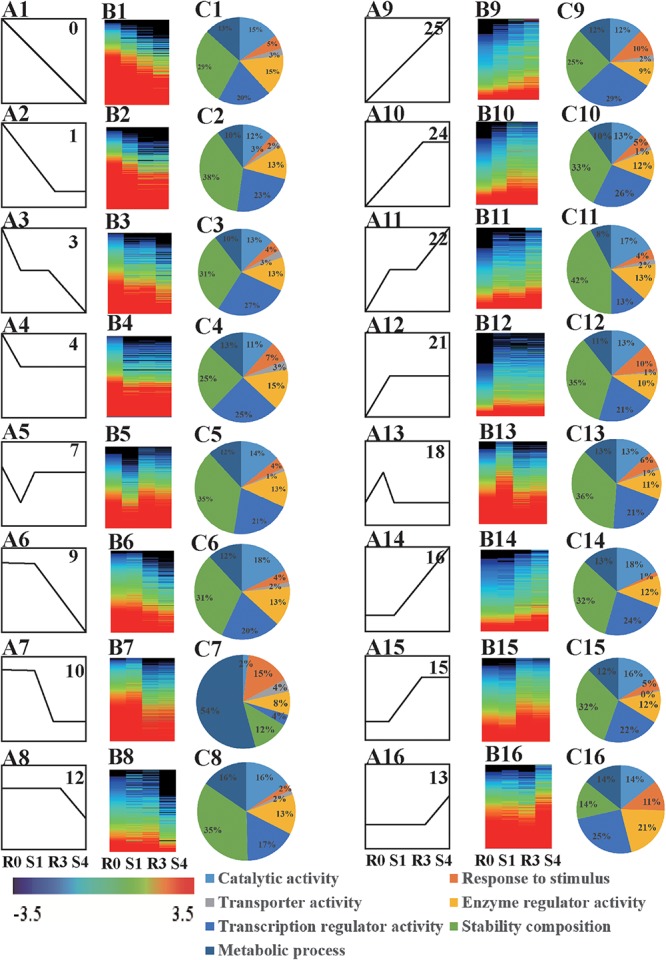
Analysis of memory genes. (A) Expression profiles of drought memory genes (A1–A16). (B) Heatmap of expression profiles indicated in (A) (B1–B16). (C) GO biological processes, cellular components, and molecular functions enriched (FDR < 0.05) among drought memory genes indicated in (A) (C1–C16).
