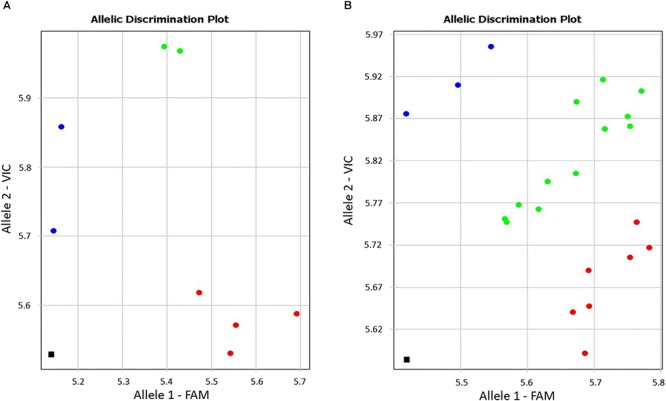
Figure 1.

Allele discrimination in eight wheat cultivars (A) and in the segregating population 18-6 (B) using the Amplifluor-like SNP marker KATU-W62. X- and Y-axes show relative amplification units, ΔRn, for FAM and VIC fluorescence signals, respectively. Red dots represent homozygote (aa) genotypes with allele 1 (FAM) associated with the high yielding cultivars, blue dots represent homozygote (bb) genotypes for allele 2 (VIC), and green dots represent heterozygote (ab) or mixed genotypes identified with automatic SNP calling. The black squares show the no template control (NTC) using water instead of template DNA.
