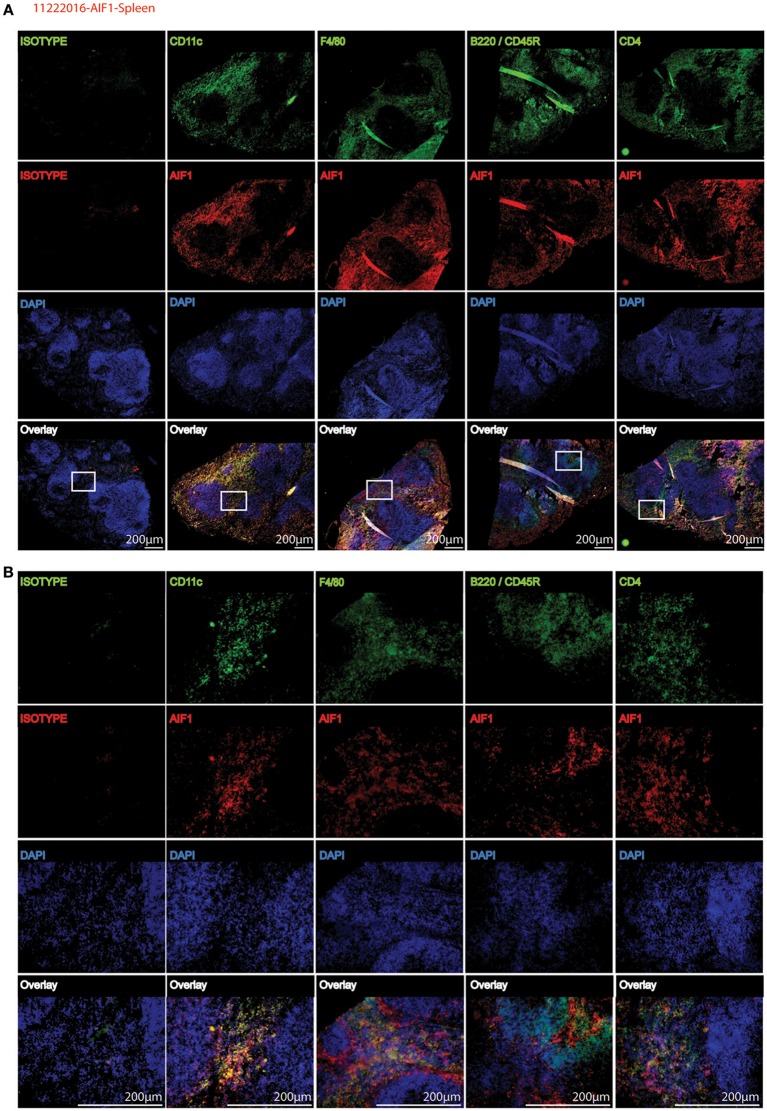
Figure 2.
AIF1 is dominantly expressed in splenic myeloid subsets. Fluorescence microscopy was performed on 20 μm spleen sections evaluating AIF1 expression (red) co-stained for CD11c, F4/80, CD45R (B220), or CD4 (green) with respective isotype controls. DAPI was used to stain for nuclei (blue). Stained sections were imaged at (A) 4X and (B) 20X magnifications. Sections in the white box area of 4X images (top) represents respective magnified 20X images (below). Images were captured on an Olympus FSX100 fluorescence microscope. Data is representative of three independent experiments.

