
Figure 4.
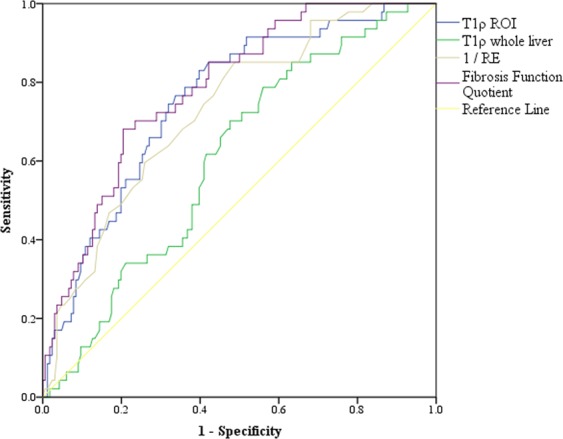
ROC-curves for the differentiation between liver cirrhosis and noncirrhotic liver parenchyma of T1ρ circular region of interest (cROI), T1ρ whole liver, relative enhancement and fibrosis function quotient.
Official websites use .gov
A
.gov website belongs to an official
government organization in the United States.
Secure .gov websites use HTTPS
A lock (
) or https:// means you've safely
connected to the .gov website. Share sensitive
information only on official, secure websites.
ROC-curves for the differentiation between liver cirrhosis and noncirrhotic liver parenchyma of T1ρ circular region of interest (cROI), T1ρ whole liver, relative enhancement and fibrosis function quotient.