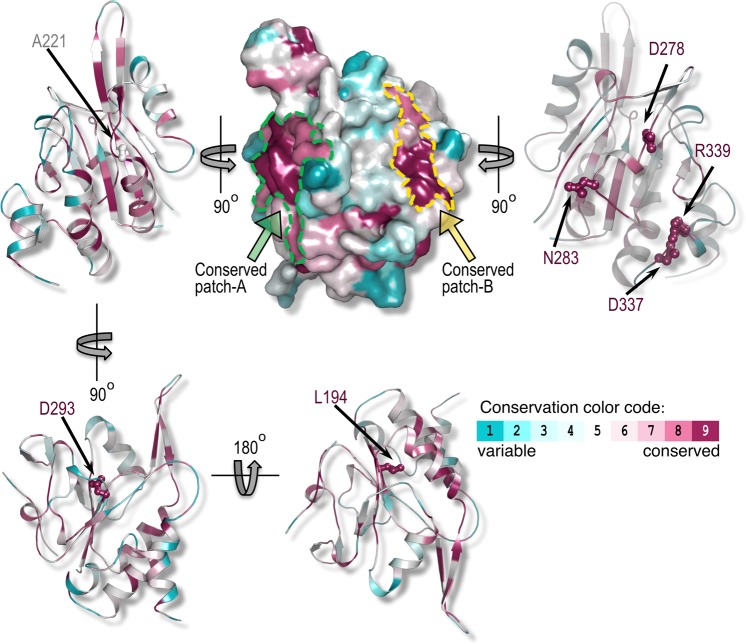
Figure 2.
Mapping of the residues identified in the ts mutants on the structure of Tim50. Residues mutated in the Tim50 mutants identified in this study were projected on a three dimensional structure of Tim50 (PDB entry 4qqf). Residues are color coded based on their conservation level as calculated by Consurf31 (see color code ruler; cyan, most variable; maroon, most conserved). Mutated residues are rendered as ball-and-stick models. Two highly conserved patches (designated as patch-A and patch-B) are shown in the top middle panel. The molecule is rotated by +/− 90 degrees on the Y-axis in order to visualize the positions of the individual residues in these patches. The conserved residues D293 and L194, which are buried in the core of the protein and are not part of the identified patches, are shown in the bottom panels.

