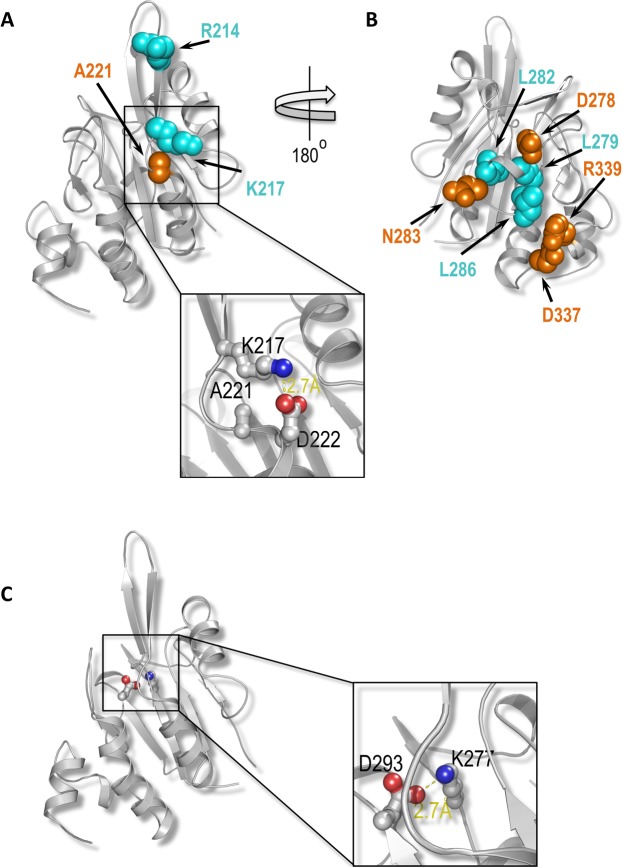
Figure 6.
Molecular insight into regions of Tim50 involved in interaction with Tim23. (A) Residue A221 (orange) identified in the screen here is close to residues R214 and K217 (both in cyan) that were previously implicated in Tim50 interaction with Tim23 by Qian et al.16. The inset depicts the electrostatic interaction between K217 and D222 that is likely changed by A221D mutation, see text for details. Amino group in the lysine side chain is shown in blue and two oxygen atoms in the carboxyl group of the aspartate side chain are shown in red. (B) Residues D278, N283, D337 and R339 (all in orange) mutated in ts mutants identified in the present screen map closely to residues L279, L282 and L286 (all in cyan) previously implicated in Tim50-Tim23 interaction by Tamura et al.24. The model shown in (B) is rotated by 180° relative to the model shown in (A). The orientations shown in panels A and B correspond to the orientations shown in the top right and top left panels, respectively, in Fig. 2. (C) Mapping of residue D293 identified here in the screen on the structure of Tim50. The inset depicts the electrostatic interaction between K277 and D293 that is likely affected by D293N mutation, see text for details. Amino group in the lysine side chain is shown in blue and two oxygen atoms in the carboxyl group of the aspartate side chain are shown in red.

