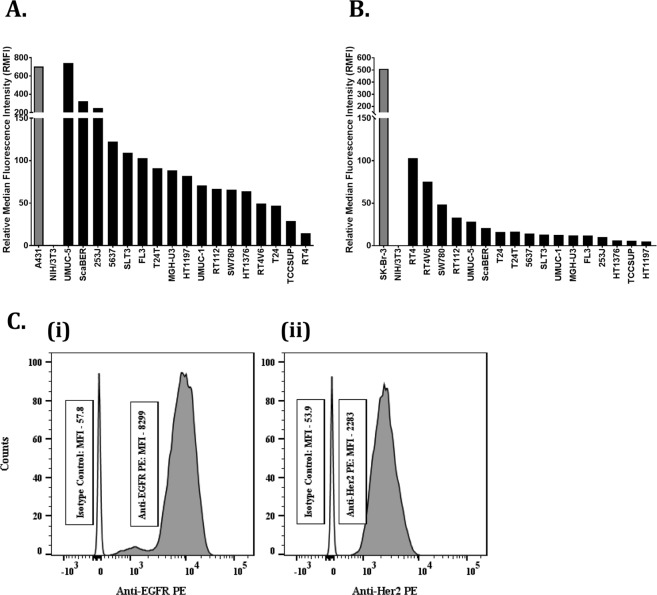
Figure 2.
EGFR and HER2 expression in bladder cancer cell lines. Surface expressions of EGFR and HER2 on various bladder cancer cell lines were studied using flow cytometry. (A) Cell-surface expression of EGFR and (B) HER2 on the same set of bladder cancer cell lines. Briefly, single cell suspension of these cells was incubated with PE-tagged mouse MAb to HER2 or EGFR or PE-tagged mouse isotype control antibodies. The experiment was carried out at room temperature. At the end of 1 h incubation, the cells were washed and analyzed on the flow cytometer. The relative median fluorescence intensity (RMFI) for each cell line was calculated by the formula: The RFMI of positive control is shown in grey, and the expression of both EGFR and HER2 in all conventional bladder cancer cell lines are shown in solid black bars. (C) Flow cytometry analysis showing (i) EGFR and (ii) HER2 expression in the SW780 cell line. Individual median fluorescence intensities (MFIs) of anti-EGFR PE, anti-Her2 PE and their corresponding isotype controls for SW780 cell line are indicated in the boxes.

