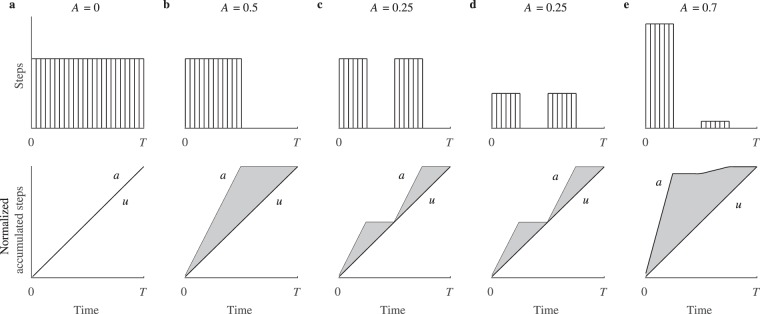
Figure 1.
Graphical illustration of the computed physical activity aggregation A for various activity patterns. Physical activity patterns (above) with corresponding normalized accumulated steps (below) of actual (a) and reference uniform (u) distributions: (a) an evenly spread physical activity over the entire monitoring period, (b) a continuous single session with a duration of half of the total monitoring period, (c) two equal sessions of high intensity, (d) two equal sessions of low intensity, (e) two sessions of unequal intensity.

