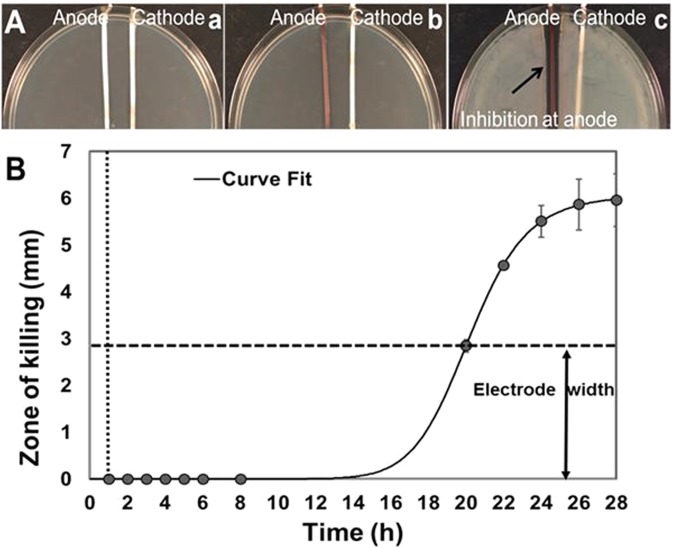
Figure 9.
(A) Generation of inhibitory product after 1 h of applying current. (a) Petri dishes containing TSA medium with Ag electrodes and without bacteria were treated with DC for 1 h. (b) Current was switched off and the agar spread with PA. (c) After 24 h, a clear zone of inhibition around the anode was evident. (B) Killing of lawn biofilms of PA grown on TSA after applying current for 1 h (vertical dashed line). The zone of killing continued to extend beyond the width of the electrodes (indicated by horizontal dashed line) upto 27 h after turning the current off. Vertical dotted line shows the time t = 1 h when current was turned off. Curve fitting was done using the online freeware, MyCurveFit.

