Figure 3.
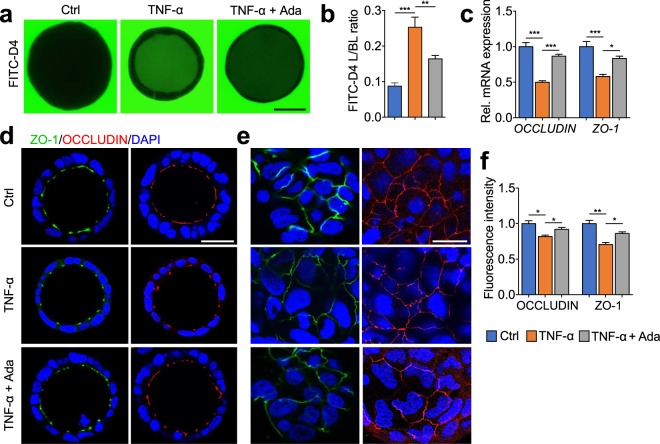
Effects of TNF-α and adalimumab on paracellular permeability, OCCLUDIN and ZO-1 in 3D Caco-2 cysts. Caco-2 cysts were exposed at the basal side to medium only (Ctrl), TNF-α (25 pg/mL) with or without pre-incubation of adalimumab (20 μg/mL) for 24 hours. (a) Representative images showing the intraluminal accumulation of FITC-dextran-4 (FITC-D4, green) in the Caco-2 cysts. Bar indicates 50 μm. (b) The mean FITC-D4 intensity of Caco-2 cysts measured and expressed as the L/BL ratio of the luminal (L) over the basal (BL) compartment. (c) mRNA levels of OCCLUDIN and ZO-1 in 3D Caco-2 cysts. (d–f) Confocal microscopy analyses of ZO-1 (green), OCCLUDIN (red) and nuclei (blue). Images in (d) were captured from the middle cross-section of 3D cysts. Bar indicates 50 μm. Images in (e) were captured from the top surface of 3D cysts. Bar indicates 20 μm. Quantified fluorescence intensities in (d) are shown in (f). All graphs represent the results of three replicate experiments. Data expressed as means ± SEM with at least 8 cysts per treatment. *P < 0.05; **P < 0.01; ***P < 0.001 by one-way ANOVA and Tukey’s post-hoc test.

