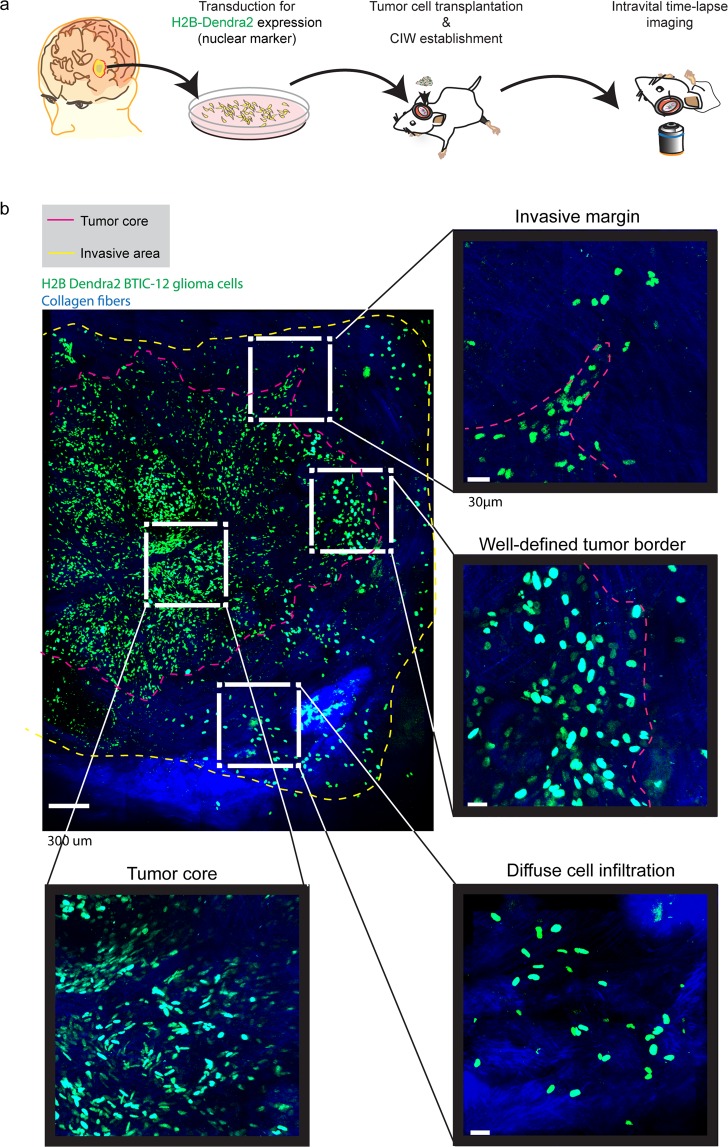
Figure 1.
Tumor border configuration in the interphase between normal brain and tumor core. (a) Schematic overview of the experimental setup. Patient derived BTIC lines expressing H2B Dendra2 where implanted in the brain of NSG mice. Time-lapse intravital imaging was performed through a CIW to study the invasive behavior of single tumor cells. (b) Representative 3D reconstructed tile-scan showing distinct tumor border configurations. Shown are H2B expressing BTICs in green, collagen fibers in blue. The dotted pink line delineates the tumor core, while the dotted yellow line delineates the tumor cell invasive area. Scale bar = 300 μm.

