Figure 2.
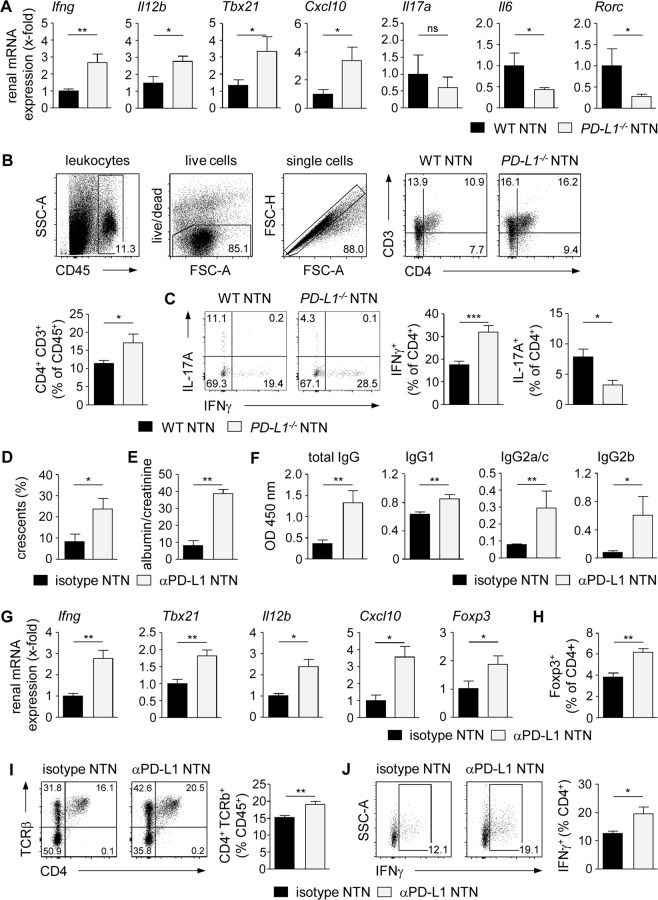
Increased frequency of renal IFNγ+ Th1 cells in nephritic PD-L1−/− mice. (A) PD-L1−/− and WT mice received i.p. NTN serum and were analyzed 8 days later. Renal mRNA expression of nephritic PD-L1−/− mice was analyzed by quantitative real-time RT-PCR and normalized to mRNA expression of nephritic WT mice. (B) Frequency of renal CD4+ T cells was determined by flow cytometry. (C) Expression of IFNγ and IL-17A in renal CD4+ T cells of nephritic PD-L1−/− and WT mice was analyzed by flow cytometry. Gating strategy and representative dot plots are shown. (D) WT mice received i.p. an anti-PD-L1 antibody or the respective isotype control and were analyzed 8 days after NTN induction. Crescent formation was quantified in PAS-stained kidney sections of anti-PD-L1 antibody-treated and isotype-treated nephritic WT mice. (E) Albumin-creatinine-ratio was determined in urine by ELISA. (F) Mouse anti-sheep IgG antibody levels were determined in serum by ELISA. (G) Renal mRNA expression of anti-PD-L1 antibody-treated nephritic WT mice was analyzed by quantitative real-time RT-PCR and normalized to mRNA expression of isotype-treated nephritic WT mice. (H) Frequencies of renal Foxp3+ Tregs, (I) CD4+ T cells, and (J) IFNγ+ CD4+ T cells were determined in anti-PD-L1 antibody-treated and isotype-treated nephritic WT mice by flow cytometry. Mean ± SEM of one experiment out of 2–3 experiments with 5–6 mice per group are shown. *p < 0.05; **p < 0.01; ***p < 0.001; ns, not significant; Il12b: IL-12 subunit p40; Tbx21: T-bet; Rorc: RORγt.

