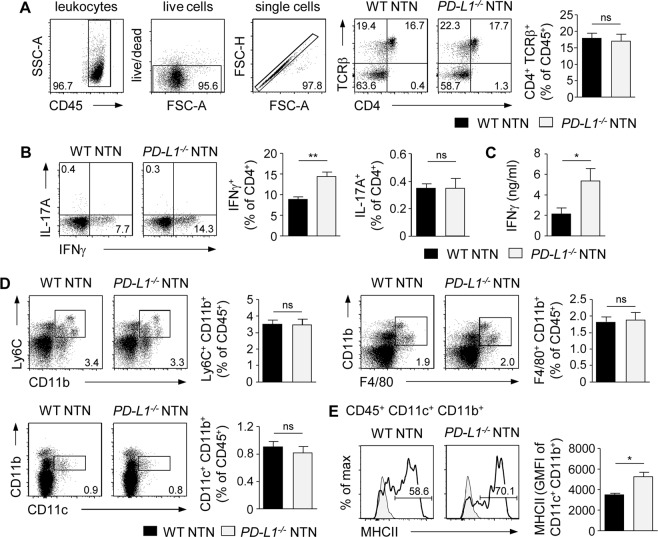
Figure 3.
Enhanced systemic Th1 immune response in nephritic PD-L1−/− mice. NTN was induced in PD-L1−/− and WT mice that were analyzed 8 days later. (A) Frequency of splenic CD4+ T cells from nephritic PD-L1−/− and WT mice was determined by flow cytometry. Gating strategy and representative dot plots are shown. (B) IFNγ and IL-17A expression was analyzed in splenic CD4+ T cells. (C) IFNγ levels in culture supernatants of sheep IgG-stimulated splenocytes from nephritic PD-L1−/− and WT mice were measured by ELISA. (D) Frequencies of splenic Ly6C+ CD11b+ monocytes/macrophages, F4/80+ CD11b+ macrophages, and CD11c+ CD11b+ DCs from nephritic PD-L1−/− and WT mice were determined. (E) Frequency and geometric mean fluorescent intensity (GMFI) of MHCII expressed by splenic DCs from nephritic PD-L1−/− and WT mice was analyzed by flow cytometry. Representative dot plots and histograms are shown. Mean ± SEM of one experiment out of 2–3 experiments with 4–5 mice per group are shown. *p < 0.05; **p < 0.01; ns, not significant.

