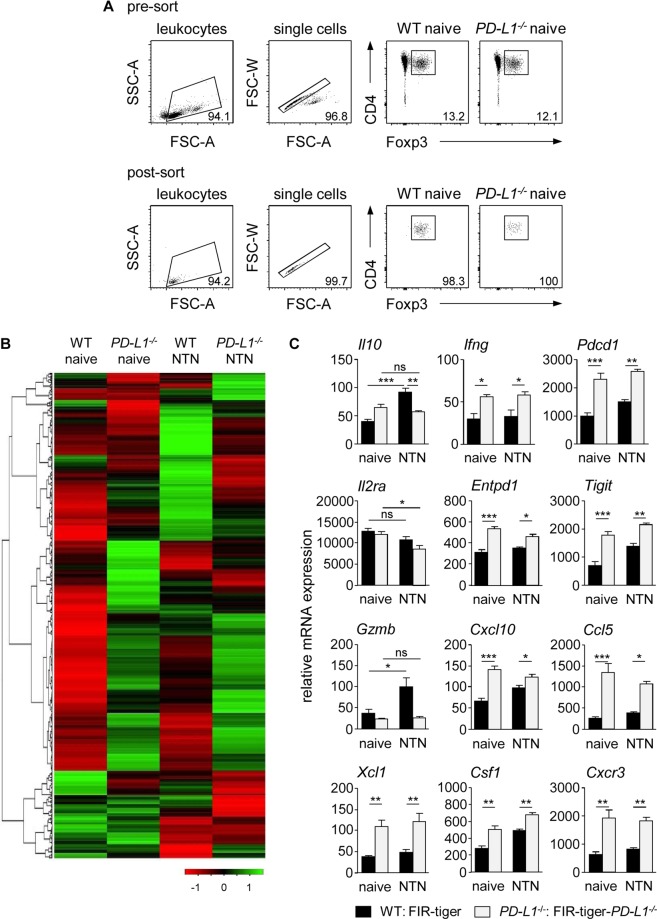
Figure 5.
Lack of PD-L1 altered gene expression profile of Tregs. (A) Foxp3+ Tregs were isolated by FACS from naive and nephritic FIR-tiger-PD-L1−/− and FIR-tiger mice. Representative dot plots show sorting strategy and purity of isolated Tregs. (B) NanoString analysis was done with FACS-isolated Tregs from naive and nephritic FIR-tiger-PD-L1−/− and FIR-tiger mice. Heatmap of immunological gene expression in Tregs is shown. (C) Relative gene expression levels of Tregs from naive and nephritic FIR-tiger-PD-L1−/− and FIR-tiger mice are shown. Columns and bar graphs show mean values of three independent experiments. *p < 0.05; **p < 0.01; ***p < 0.001; ns, not significant; Pdcd1: PD-1; Il2ra: IL-2 receptor subunit alpha; Entpd1: CD39; Gzmb: granzyme B; Csf1: colony stimulating factor 1.

