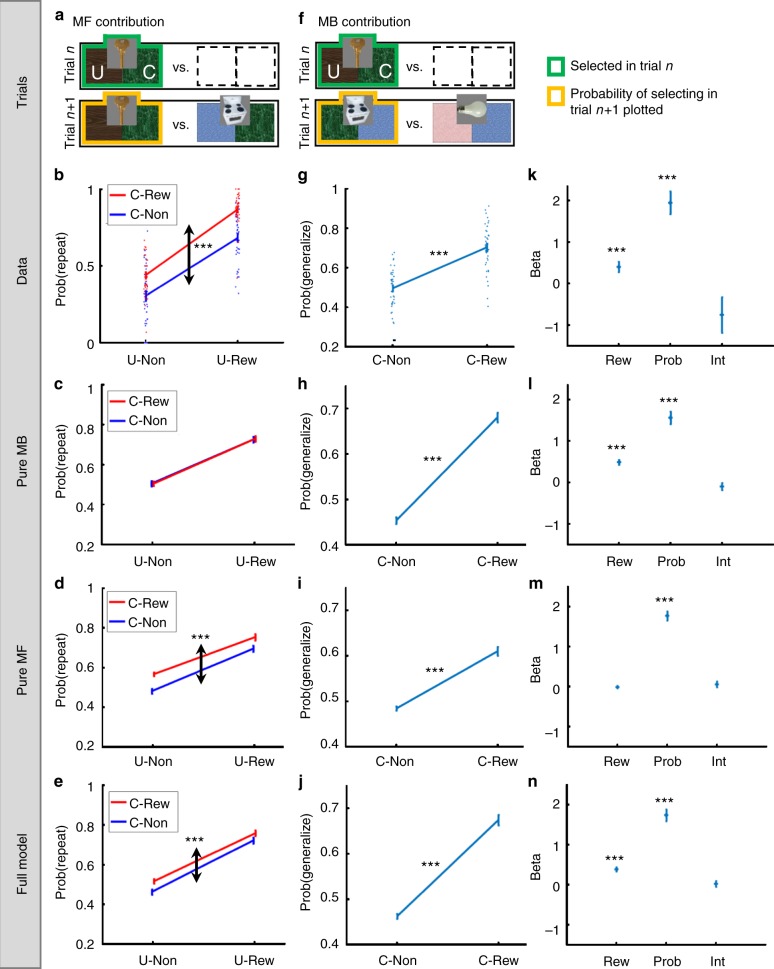
Fig. 2.
MF and MB contributions to performance. a In showing a contribution of the MF system, we analysed only standard trials that followed a standard trial and that offered for choice the previously chosen object. For clarity, we represent objects by their associated pair of rooms; in the experiment participants saw the object images alone. Places for objects whose identity did not affect the analysis (and were marginalized over) are left empty. b The empirical probability of repeating a choice as a function of the previous-trial Common (“C”), and Unique (“U”) outcomes. The main effect of the Common outcome highlights an MF contribution to bandit choices. c Indeed, a pure MB model failed to predict this effect (our models are described in the computational modelling section), d but a pure MF-action model predicted it. e The full model predicted this effect. f In showing a contribution of the MB system, we analysed only standard trials that followed a standard trial and that excluded the previously chosen object. g The empirical main effect of the Common room on generalization probability. h–j The pure MB, pure MF and the full model, all predicted a positive effect for the Common room. k The empirical coefficients of the trial-n Common room’s outcome (unrewarded vs. rewarded; Rew), reward probability (Prob) and their interaction (Int) when choice generalization is regressed on these variables. The positive coefficient of the Common outcome highlights a MB contribution to bandit choices. l Indeed, a pure MB model predicted a positive coefficient for the Common reward, m whereas a pure MF-action model did not. n The full model predicted a positive coefficient for the Common outcome. Error bars correspond to SEM across-participants calculated separately in each condition (n = 40). Dotted arrows indicate the main effect of focal interest. *,** and *** denote p < 0.05, p < 0 .01 and p < 0.001, respectively. When no asterisk appears, the effect of interest is non-significant (p > 0.05). In g–j p-values were calculated based on paired-samples t-tests. In panels b–e, k–n p-values were calculated based on mixed effects logistic regression models. Dots in panels b, g correspond to individual participant results. Images adapted from the stimulus set of Kiani et al. 2007, ref. 40

