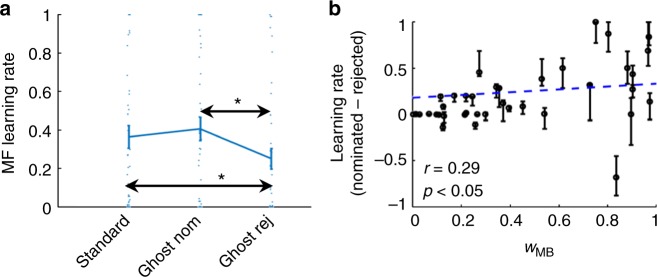
Fig. 6.
Analyses based on the ML parameters of the full model. a Group averaged MF learning rates for standard trials, ghost-nominated and the ghost-rejected object. Error bars represent standard errors, n = 40. * denotes p < 0.05 according to a mixed effects linear model. Dots represents individual participants. b The specificity of MF learning, i.e. the contrast between learning rates for the ghost-nominated and rejected objects (ordinate), is plotted against the relative MB contribution (abscissa). Each dot corresponds to a single participant. The dashed line is the regression line. Error bars represent the densest interval that contained 50% of the mass of the estimated learning-rate difference distribution obtained by parametrically bootstrapping the data (see methods for details). The p-value was calculated based on a one-sided permutation test

