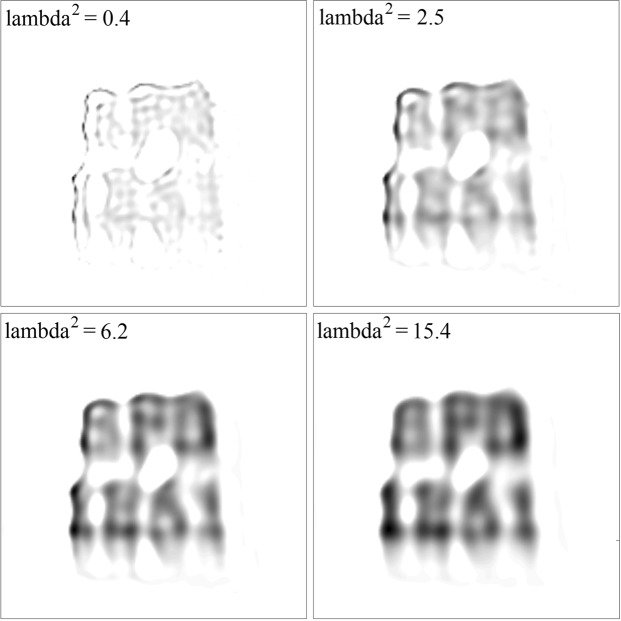
Figure 6.
Estimated source distributions for magnetic field data recorded by an ME sensor from an experimental distribution of particles forming the letters ‘SFB 1261’. The data were processed by the SBB-NNLS algorithm with regularization. For the regularization parameter, four different values were chosen, as inserted. Densities of estimated source distributions are given by a black-white color map, with white corresponding to zero and black to the maximum density (maximum density differs for different regularization parameters).

