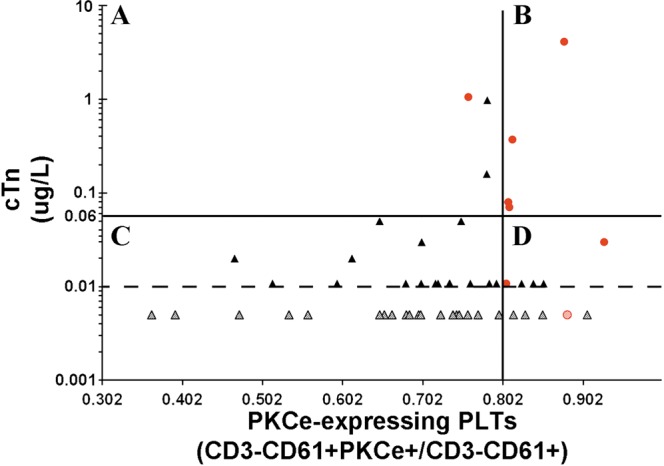
Figure 4.

Combination of cut-off points of PKCe-expressing PLTs and cTnI. Chest pain patients of the subset population are represented according to their values of cTnI (Y-axis) and PKCe-expressing PLTs (X-axis) at presentation to ED. The cut-off values of each parameter are represented as black lines and limit of detection of cTnI is represented as dotted black line. Red spots represent CP-AMI, black triangles represent CP-noAMI patients, and patients with undetectable values of cTnI are represented as dotted spots and triangles.
