Fig. 1.
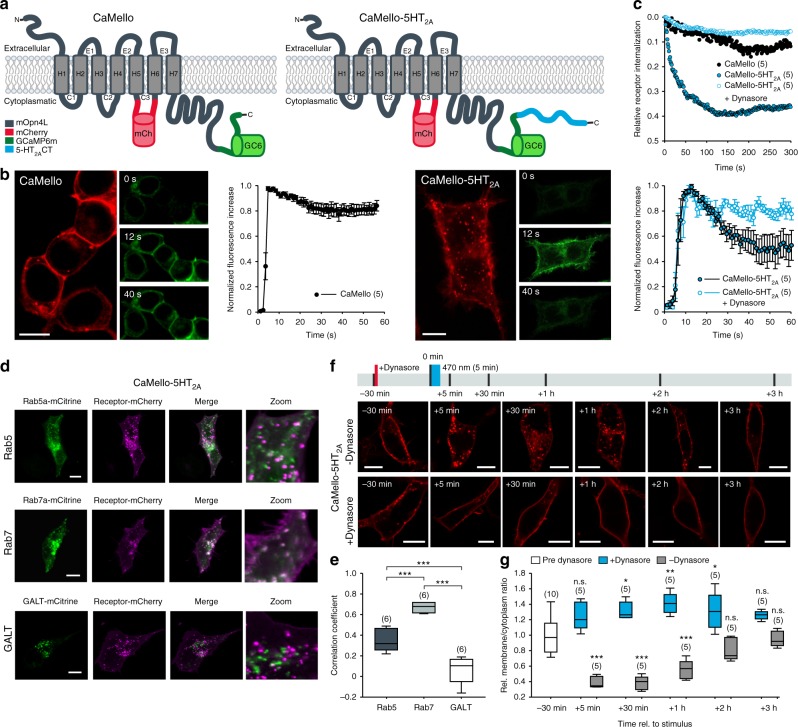
Optogenetic control and visualization of Ca2+ signals with CaMello-XRs. a CaMello and CaMello-5HT2A design. Both chimeric constructs consist of mouse melanopsin (mOpn4L), mCherry inserted into C3 and GCaMP6m added to the CT. CaMello-5HT2A additionally has the 5-HT2A receptor CT appended (C: intracellular loop; CT: C-terminus; H: transmembrane helix; E: extracellular loop). b Time course of light-induced Ca2+ responses in HEK tsA201 cells. Transfected cells were visualized (mCherry, 561 nm) and Ca2+ signals were measured (GCaMP6m, 476 + 495 nm) (images). Normalized Ca2+ responses during 60 s of illumination (graphs), for CaMello-5HT2A with/without addition of dynamin inhibitor Dynasore (50 µM) (mean ± s.e.m.; n = 5 dishes). Scale bar, 10 µm. c Normalized activation-dependent receptor internalization monitored via differences in membrane-localized mCherry fluorescence reduction between stimulated (476 nm + 561 nm) and unstimulated (561 nm) trials, for CaMello-5HT2A with/without addition of Dynasore (50 µM) (mean; n = 5 dishes). d Colocalization of CaMello-5HT2A with Rab5a (-mCitrine, early endosome), Rab7a (early to late endosome) or GALT (beta-1,4-galactosyltransferase 1, trans-Golgi network) 5 min post stimulation with 476 nm light (5 min). Scale bar, 10 µm. e Averages of the calculated Pearson’s correlation coefficient for the colocalization as shown in d (box plot; one-way analysis of variance (ANOVA) and Holm-Sidak multiple comparison method; n = 6 individual cells for each colocalization pairing; ***p < 0.001). f Time course (confocal z-sections) of activation-dependent receptor internalization/recycling for CaMello-5HT2A. Cells were stimulated with blue light (476 nm, 5 min) at 0 min and receptor internalization/recycling was monitored over time. At −30 min Dynasore (50 µM) was added to the culture medium (control group). Scale bar, 10 µm. g Relative membrane to cytoplasm ratio as seen in (f) was calculated at indicated time points via quantitative mCherry fluorescence intensity analysis (box plot; one-way repeated measures analysis of variance (RM ANOVA) versus control and Holm-Sidak multiple comparison method; n = (x), # of individual cells per group; n.s. = not significant,*p < 0.05, **p < 0.01, ***p < 0.001; p left to right: 0.064, < 0.001, 0.037, < 0.001, 0.003, < 0.001, 0.036, 0.081, 0.101, 0.393)

