Fig. 3.
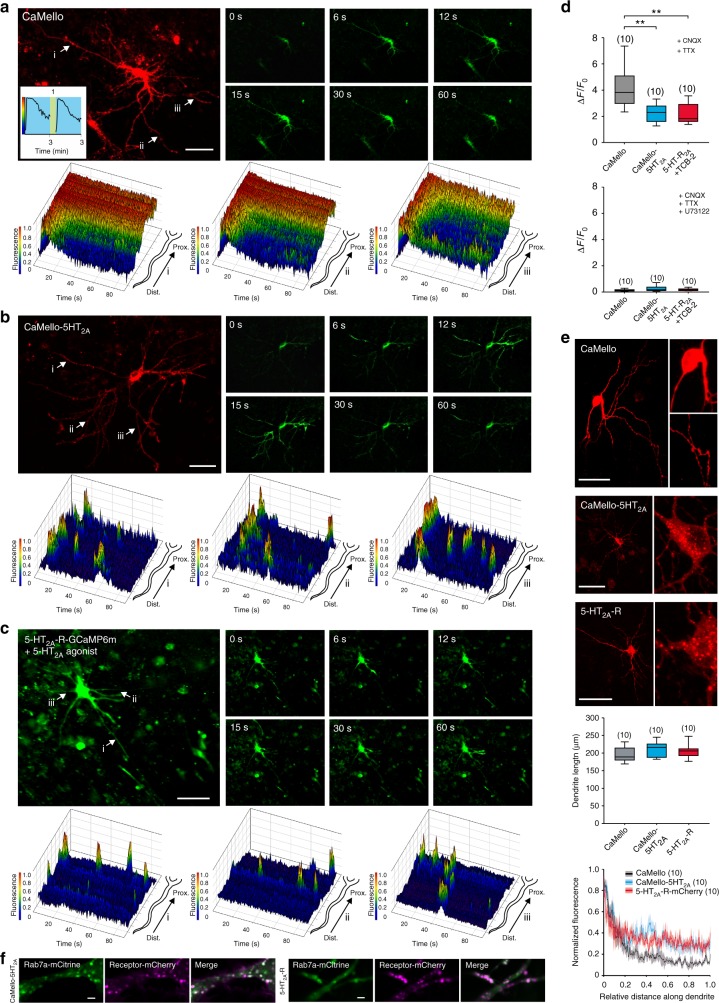
Optogenetic control and visualization of local Ca2+ signals in rat visual cortex organotypic cultures (OTCs). a–c Time course of light-induced (a, b) and agonist-induced (c) local Ca2+ responses in rat visual cortex OTCs. Transfected cells were visualized using the mCherry reporter (CaMello + CaMello-5HT2A) or GCaMP6m (5-HT2A-R) and Ca2+ signals were light-induced (CaMello + CaMello-5HT2A, 476 + 495 nm) or agonist-induced (5-HT2A receptor, TCB-2 20 µM) and measured via GCaMP6m monitoring (images). 3D mesh plots of individual neurites (i, ii, iii) showing normalized local light-induced (CaMello + CaMello-5HT2A) or agonist-induced (5-HT2A-R) Ca2+ responses during 90 s of illumination from distal to proximal (plots). Repetitive activation and deactivation (561 nm) of CaMello induced Ca2+ responses (inset). Scale bar, 50 µm. d Comparison of maximal change in induced fluorescence intensity (∆F/F0). Maximal change in ∆F/F0 in the presence of CNQX (1 µM) and TTX (1 µM) (box plots; one-way analysis of variance (ANOVA) and Holm-Sidak multiple comparison method; n = 10 individual cells, pooled from five animals per group; **p < 0.01; p left to right: 0.001, 0.001) (top). Maximal change in ∆F/F0 in the presence of CNQX (1 µM), TTX (1 µM) and PLC antagonist U73122 (10 µM) (box plots; n = 10 individual cells, pooled from five animals per group) (bottom). e Differential expression pattern of CaMello, CaMello-5HT2A, and the 5-HT2A-R mCherry constructs in rat cortical neurons (OTCs). Receptor expression pattern was visualized using the mCherry reporter (561 nm) (images). Normalized fluorescence of the longest dendrite (length = box plot) was plotted against the length of each dendrite (plot) (box plots; n = 10 individual cells, pooled from five animals per group). Scale bar, 50 µm. f Colocalization of CaMello-5HT2A and the 5-HT2A-R mCherry construct with Rab7a in OTCs of the rat visual cortex as seen in Fig. 1 and Supplementary Figure 1 for HEK cells. Scale bar, 2 µm

