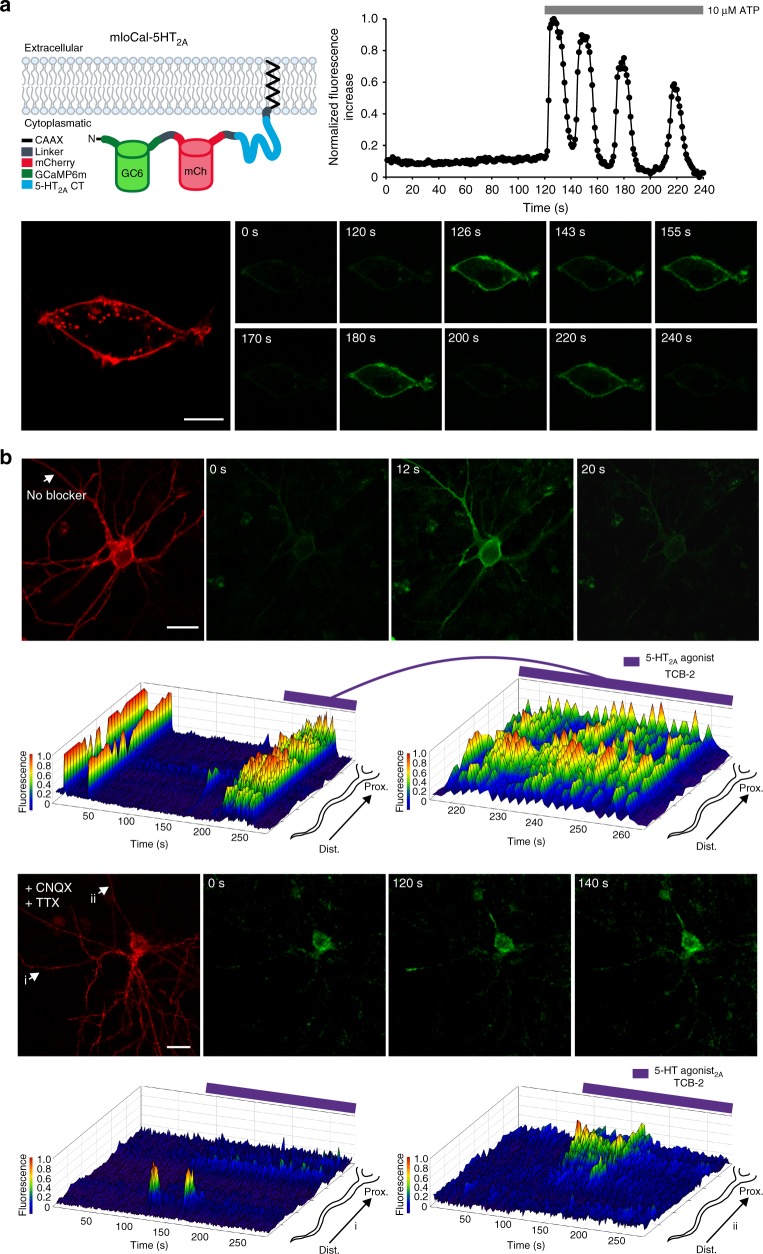
Fig. 4.
Visualization of local Ca2+ signals in HEK cells and rat visual cortex organotypic cultures (OTCs) induced by endogenous GPCRs using mloCal-5HT2A. a mloCal-5HT2A design. The construct consists of an N-terminal GCaMP6m linked to mCherry, the 5-HT2A receptor C-terminus (CT) and a C-terminal CAAX membrane anchor (human KRAS isoform B C-terminal domain) (schematic). Time course of ATP-induced (10 µM) membrane-localized Ca2+ responses in HEK tsA201 cells transfected with mLocal-5HT2A (graph). Cells were visualized using the mCherry reporter (561 nm) and ATP-induced Ca2+ signals were measured via GCaMP6m monitoring (476 + 495 nm) (images). Scale bar, 10 µm. b Time course of neuronal network driven and 5-HT2A-R agonist modulated (TCB-2 20 µM) local Ca2+ responses in rat visual cortex OTCs without network blockers. Transfected cells were visualized using the mCherry reporter (561 nm) and Ca2+ signals were measured via GCaMP6m monitoring (476 + 495 nm) (top images). 3D mesh plot of an individual neurite (arrow) showing normalized local Ca2+ responses during 280 s of illumination with additional 5-HT2A agonist stimulation after 180 s from distal to proximal (top plots). Time course of 5-HT2A agonist modulated (TCB-2 20 µM) local Ca2+ responses in rat visual cortex OTCs in the presence of CNQX (1 µM) and TTX (1 µM). Transfected cells were visualized using the mCherry reporter (561 nm) and Ca2+ signals were measured via GCaMP6m monitoring (476 + 495 nm) (bottom images). 3D mesh plots of individual neurites (i, ii) showing normalized local Ca2+ responses during 280 s of illumination with additional 5-HT2A-R agonist stimulation after 90 s from distal to proximal (bottom plots). Scale bar, 20 µm

