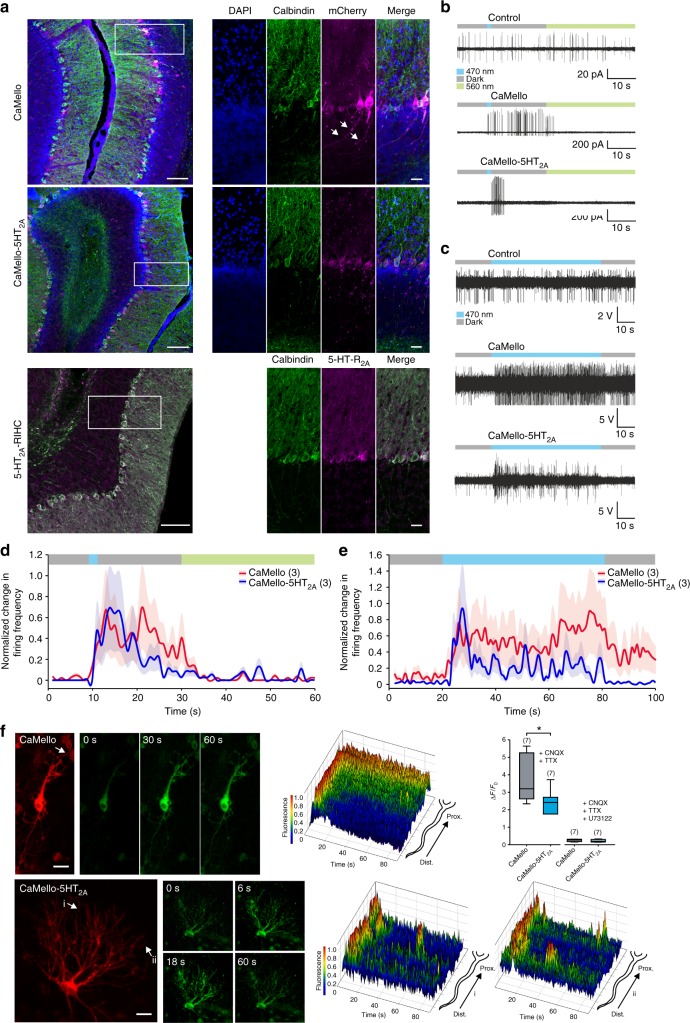
Fig. 5.
Optogenetic sustained and transient modulation of neuronal firing in the cerebellum in vivo and in vitro combined with visualization of local Ca2+ signals. a Sagittal images depicting brain sections of the cerebellar cortex expressing CaMello or CaMello-5HT2A compared to the native 5-HT2A receptor (IHC: immunohistochemistry). Scale bar, 100 µm overview, 25 µm zoom. b Example traces of light-induced modulation of Purkinje cell (PC) firing in cerebellar slices by CaMello, CaMello-5HT2A or mCherry control. The protocol to control the receptor consisted of an initial 10 s dark phase (gray) followed by a 1 s, 470 nm light pulse (blue) to activate the receptor, followed by an additional dark phase of 19 s and a 30 s, 560 nm light pulse (green) for deactivation of the receptor. c Example traces of in vivo optrode PC recordings from anaesthetized mice expressing CaMello, CaMello-5HT2A or mCherry control. The protocol to control the receptor consisted of an initial 10 s dark phase (gray) followed by a 60 s, 470 nm light pulse (blue) and an additional dark phase of 10 s. d, e Light-induced change in firing frequency for cerebellar slice recordings (d) or in vivo optrode recordings (e). Change in firing frequency during the indicated protocol (see color bar and b, c) was normalized for each individual cell for CaMello and CaMello-5HT2A and pooled (mean ± s.e.m.; n = 3 animals per group). f Time course of light-induced local Ca2+ responses in rat cerebellum OTCs. Transfected cells were visualized using the mCherry reporter and Ca2+ signals were light-induced (476 + 495 nm) and measured via GCaMP6m monitoring (images). 3D mesh plots of individual neurites (arrow: CaMello; i, ii: CaMello-5HT2A) showing normalized local light-induced Ca2+ responses during 90 s of illumination from distal to proximal (plots). Comparison of maximal change in induced fluorescence intensity (∆F/F0). Maximal change in ∆F/F0 in the presence of CNQX (1 µM) and TTX (1 µM) or additional PLC antagonist U73122 (10 µM) (box plot; unpaired t-test; n = 7 individual cells, pooled from four animals per group; *p < 0.05; p = 0.031) (box plot). Scale bar, 25 µm

