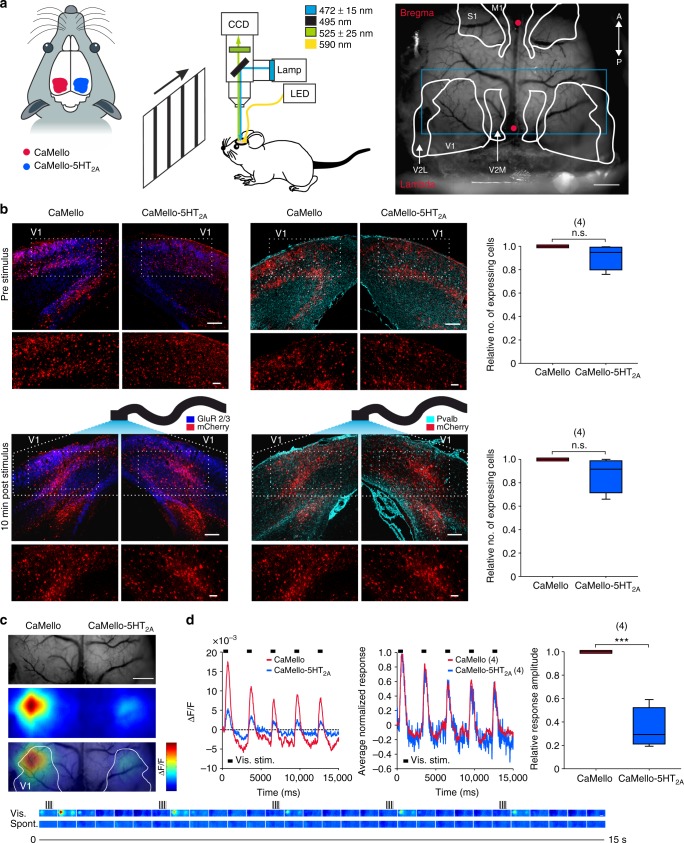
Fig. 6.
Simultaneous photostimulation and Ca2+-imaging of visually evoked responses in the primary visual cortex in vivo. a Scheme of the experimental setup. Visual stimuli were presented on a monitor at 20 cm in front of the mouse. Between recording (and photostimulation) sessions, yellow light (590 nm) was used to deactivate the constructs. Mice were anesthetized and head-fixed. Vascular pattern of the cortex overlaid with schematics showing different cortical regions (V1: primary visual; V2L: lateral secondary visual; V2M: medial secondary visual; S1: primary sensory; M1: primary motor; red dots: bregma/lambda; blue rectangle: imaged area, depicted in (c)). Scale bar, 1 mm. b Coronal images depicting brain sections of the visual cortex expressing CaMello and CaMello-5HT2A for animals before and 10 min after stimulation. Pyramidal neurons were antibody-stained against GluR2/3, while Pvalb+ neurons were stained against parvalbumin (GluR: glutamate receptor; Pvalb: parvalbumin) (images). The relative number of expressing cells in the illuminated area was compared for animals before/after stimulation (box plot; unpaired t-test; n = 4 animals per group; n.s. = not significant; p from top to bottom: 0.079, 0.067) (box plot). Scale bar, 150 µm overview, 50 µm zoom. c Depiction of the imaged area. Vascular pattern of the imaged cortical region (top). Activation across V1 and neighboring visual areas after visual stimulation with changes in activity over time shown as relative change in fluorescence (∆F/F) (middle). Overlay of the two images above (bottom). Image frames show GCaMP6m signals in response to visual stimulation (upper row, vis.) with moving gratings (see icons on top) and spontaneous activity (lower row, spont.). Changes in activity over time are expressed as relative change in fluorescence (∆F/F). Each frame represents the average fluorescence change across 500 ms of recording. Scale bar, 1 mm. d Traces depicting the time course of spatial averages across V1 for CaMello and CaMello-5HT2A in response to visual stimulation, average of 30 trials (left). Comparison of the averaged (n = 4 animals) normalized responses of both constructs (middle). Comparison of maximal visual response amplitudes (box plot; unpaired t-test; n = 4 animals; ***p < 0.001; p = 0.000137) (right)

