Fig. 1.
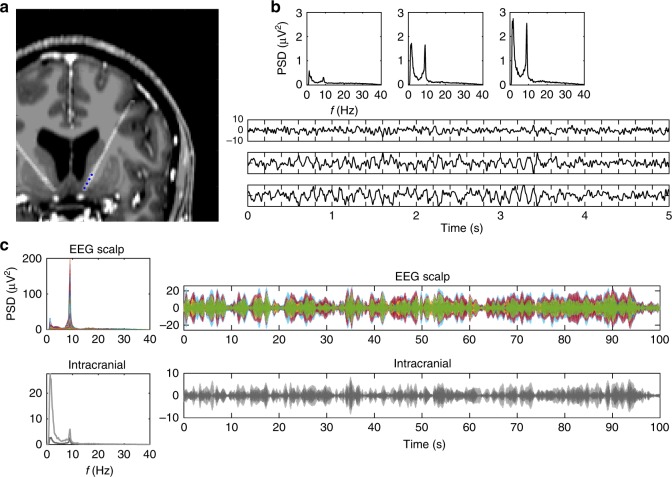
Electrode implantation and electrophysiological recordings in the OCD patient. a MRI overlaid with post-op CT scan, illustrating the location of the intracranial DBS electrodes indicated as blue dots, i.e., the nucleus accumbens, at its transition with the internal capsule in this case. b Power spectral density (PSD) and exemplary time courses are displayed from three bipolar derivations at the top, middle and lowest pair of the four intracranial electrode contacts. Note that the two most dorsal electrodes are located in the internal capsule. c PSD of scalp EEG and intracranial recordings were used to select individual alpha peak frequency (left panel). Exemplary time courses of alpha envelopes after narrow-band filtering showing similarities and differences of scalp and intracranial signals (right panel). Different colors are displaying different recording electrodes; light/dark gray colors correspond to left/right hemispheric implantation sites. All time courses are scaled in µV

