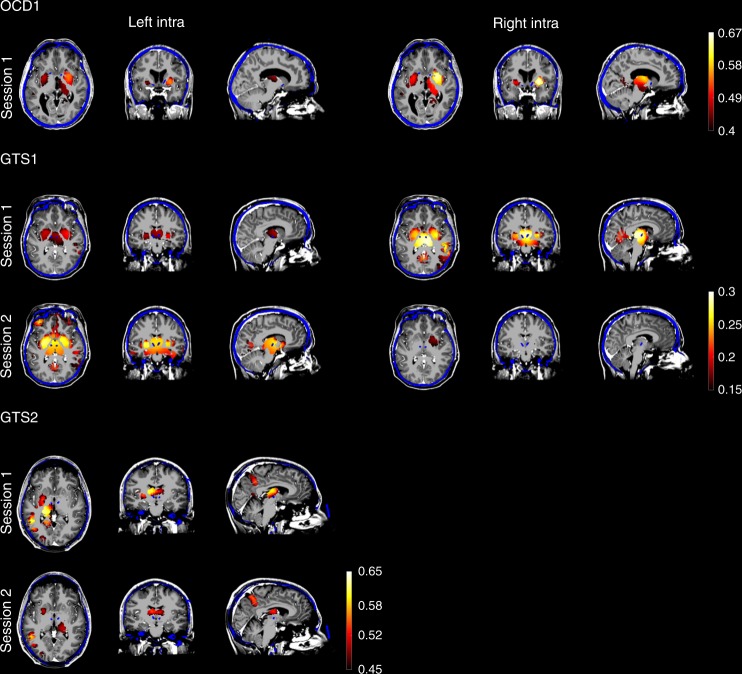
Fig. 2.
Reconstructed EEG source dynamics are correlated with actual intracranial signals. EEG source images illustrating significant correlation between source reconstructed and actually recorded alpha envelopes in subcortical areas. Intracranial electrodes are implanted in the nucleus accumbens (OCD) and in the centromedial thalamus (GTS) of the left and right hemisphere. Accordingly, highest correlations between source reconstructed and intracranial signals are located in target, i.e., implantation regions or in close proximity to it. Namely, these regions are the left/right putamen in OCD1, the left pallidum/right thalamus in GTS1, session 1, the left/right putamen in session 2 and the left thalamus in GTS2 in both recording sessions. MRI images (greyscale) are overlaid with post-op CT (blue) scans and EEG source imaging results (warm colors). Intracranial electrode positions are visible as blue dots and were used to select the view of these images

