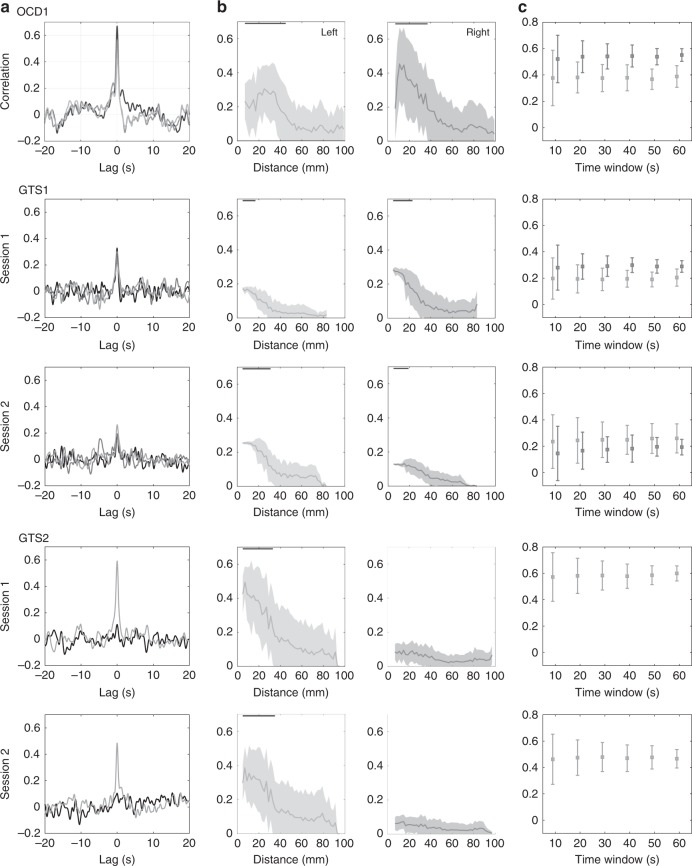
Fig. 3.
Temporal and spatial properties of the correlation analyses. a Cross-correlation between source reconstructed and actual alpha envelopes recorded at intracranial electrodes, placed in the nucleus accumbens (OCD) and centromedial thalamus (GTS) of the left/right hemisphere displayed in light/dark gray respectively. The cross-correlation between intracranial electrodes in the two hemispheres is illustrated in black. Note the considerable peak at lag zero representing precise temporal alignment between the correlated signals in contrast to smaller values if this alignment is disrupted at larger lags. For GTS2 no significant correlation was found in subcortical regions of the right hemisphere, neither between intracranial recordings and source reconstructed signals, nor between intracranial recordings between the two hemispheres. b Correlation (mean ± SD) between source reconstructed and intracranial alpha envelopes as function of the distance to intracranial electrodes. Note that the maximum in these plots represents the localization error, while the steepness of the decay with increasing distance indicates the spatial resolution in these subcortical regions. Black lines on the top show significant ranges. c Correlation values (mean ± SD) computed from different window sizes showing the robustness of the results with respect to different time scales

