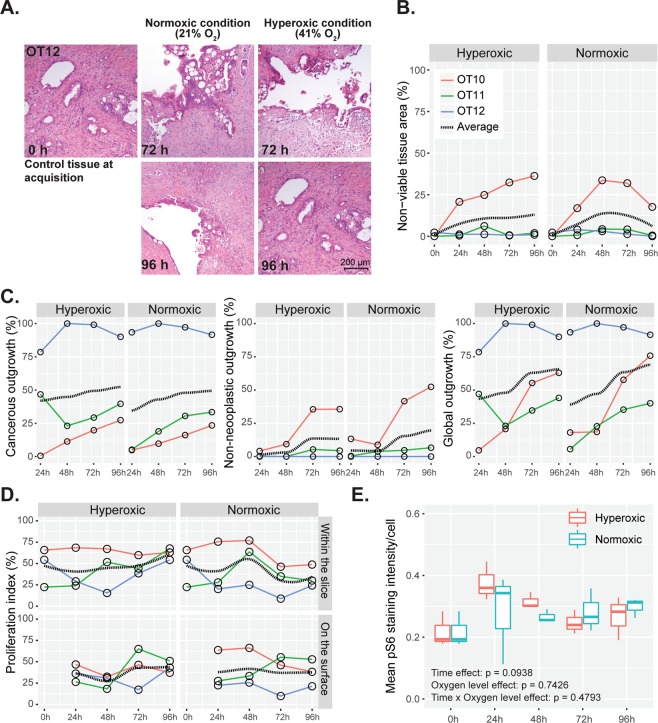
Figure 10.
Tissue viability, cellular outgrowth, proliferation and metabolic activity at different oxygen levels. (A) Comparison of tumor histomorphology under normoxic (21% O2) and hyperoxic (41% O2) conditions at different time points (H&E staining). (B) Tissue viability in paired slices obtained from the same donor samples (n = 3) when cultured under normoxic and hyperoxic conditions. The dotted black line shows the conditional mean smooth curve to demonstrate the pattern of observation under the test conditions. Legend keys are the same for (C,D). (C) Cancerous, non-neoplastic and global cell outgrowths in donor-paired tissue slices (n = 3). (D) Proliferation index of cancerous cells within and on the surface of slices at different time points when donor-matched tissue slices were cultured under normoxic and hyperoxic conditions. (E) Metabolic activity of cancerous cells when cultured under different ambient oxygen levels. (Repeated measure two-way ANOVA followed by Dunn’s multiple comparison; p > 0.05, n = 3).

