Figure 2.
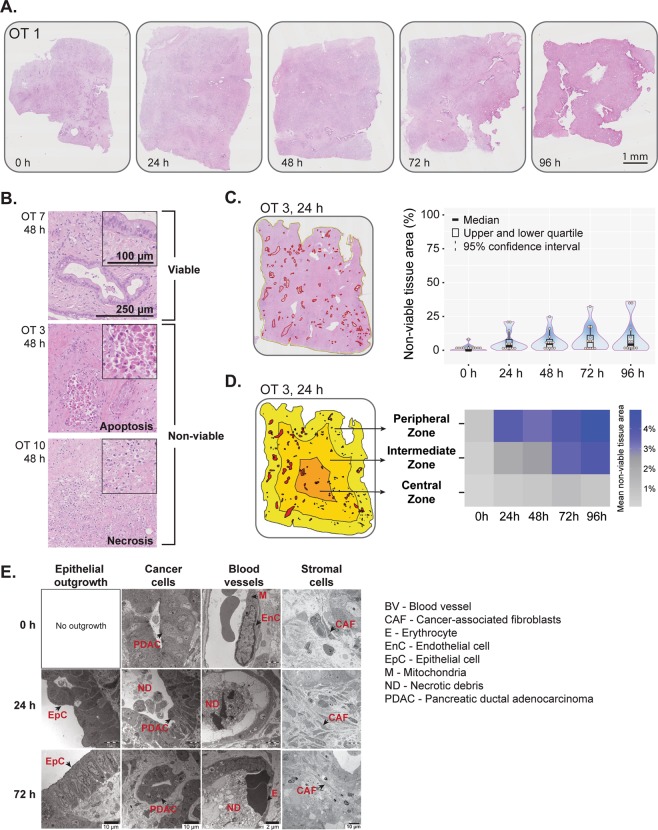
Tissue viability and structural integrity. (A) Representative overview images of H&E-stained whole tissue slices. See Figure S1 for high magnification images. (B) Representative H&E-stained tissue slices showing viable tissue and foci of apoptosis and necrosis. (C) Left panel, Digital annotation of non-viable tissue areas within the slice. Red annotated areas indicate non-viable tissue. Right panel, Quantification of non-viable tissue areas during culture time (n = 12; Friedman test followed by Dunn’s multiple comparison; p > 0.05). In the violin plot, the central band, box and whiskers represent median value, interquartile range, and maximum and minimum values, respectively. (D) Schematic diagram showing the annotation of a whole slice into 3 separate zones - peripheral, intermediate and central, each with a width of one-third of the tissue slice diameter. The heatmap shows spatial distribution of mean non-viable tissue areas (%) in the 3 zones with respect to culture time. The scale indicates mean values. (E) Representative transmission electron photomicrographs (n = 3) of control (0 h) and cultured slices (24 h and 72 h) depicting morphological alterations of epithelial outgrowth, cancer cells, blood vessels and stromal components during culture.

