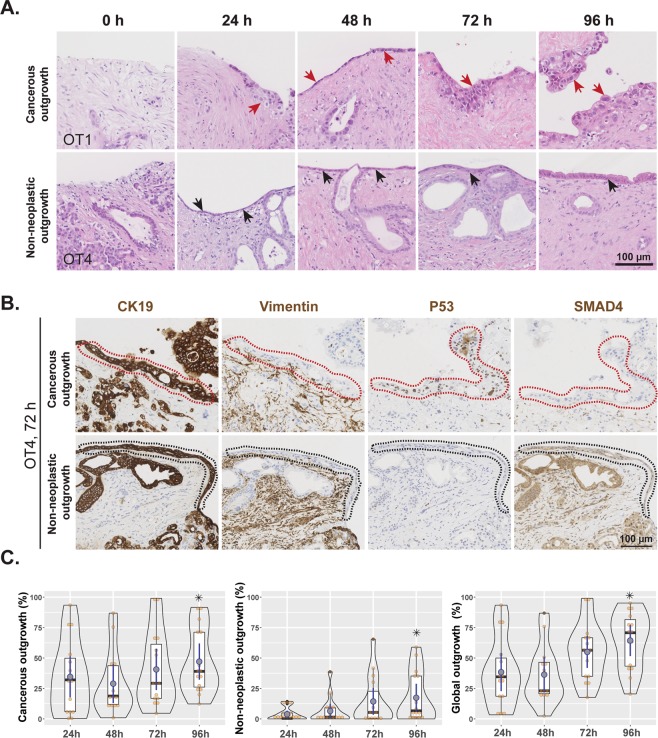
Figure 5.
Cellular outgrowth onto the tissue surface. (A) Representative H&E-stained images showing cancerous (red arrows) and non-neoplastic (black arrows) cell outgrowth at different time points (0 h to 96 h). (B) A representative example of tissue slices with areas of cancerous and non-neoplastic cell outgrowth. Immunohistochemical staining showed that both types of outgrowth were positive for CK19 and negative for vimentin, indicating that outgrowth is of ductal-epithelial origin. Cancerous cell outgrowth (red dotted areas) was positive for P53 and negative for SMAD4, in contrast to the non-neoplastic one (black dotted areas), which was negative for P53 and positive for SMAD4. (C) Comparative analysis of cancerous, non-neoplastic, and global outgrowths at the indicated time points (duplicate slices from each culture, n = 8; Friedman test followed by Dunn’s multiple comparison, p ≤ 0.05; *indicates significant difference compared to 24 h time point). Time point 0 h was omitted from analysis due to the absence of any outgrowth.

