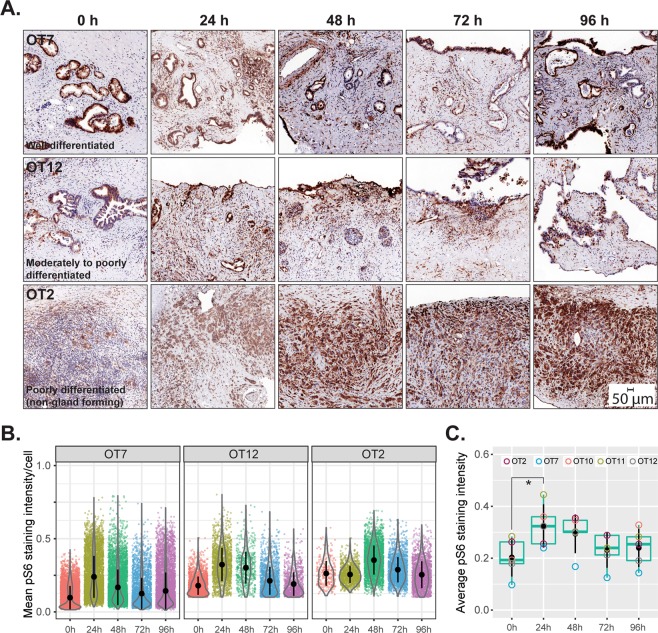
Figure 8.
Metabolic activity. (A) Phosphorylated (Ser235/236) S6 ribosomal protein was used as a marker for the activity of mTOR, a master regulator of cellular metabolism. Positivity for S6 phosphorylation in all tissue slices at all time points indicates continued metabolic activity. (B) Quantitation of pS6 staining intensity in cancerous cells at different time points from the cases depicted in (A). (C) Comparative assessment of metabolic activity (average pS6 staining intensity, n = 5) of cancerous cells in cultured slices over the entire duration of culture (Friedman test followed by Dunn’s multiple comparison; p ≤ 0.05). * indicates significant difference between the given time points.

