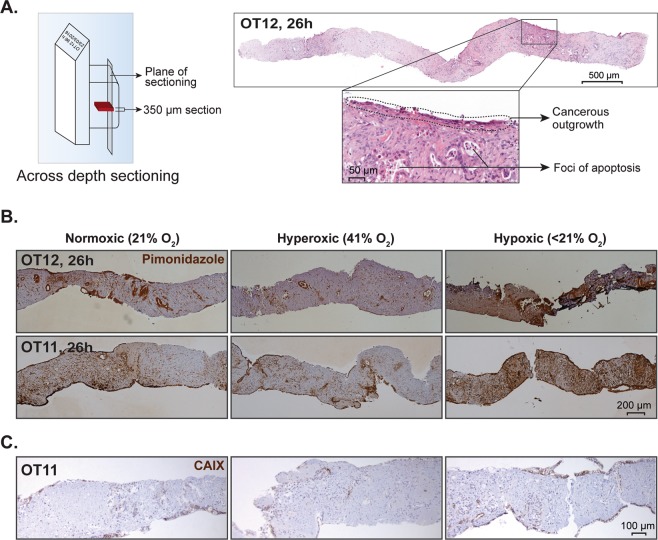
Figure 9.
Schematic diagrams for analysis of tissue oxygenation. (A) Left panel, Vertical, i.e. across depth, tissue sectioning strategy. Right panel, A representative H&E-stained section of a vertically cut tissue slice. Inset demonstrates a higher magnification image with outgrowing cells and small foci of apoptosis. (B) Pimonidazole and (C) CAIX immunostaining of tissue slices cultured in normoxic (21% O2), hyperoxic (41% O2), and hypoxic (<21% O2) conditions.

