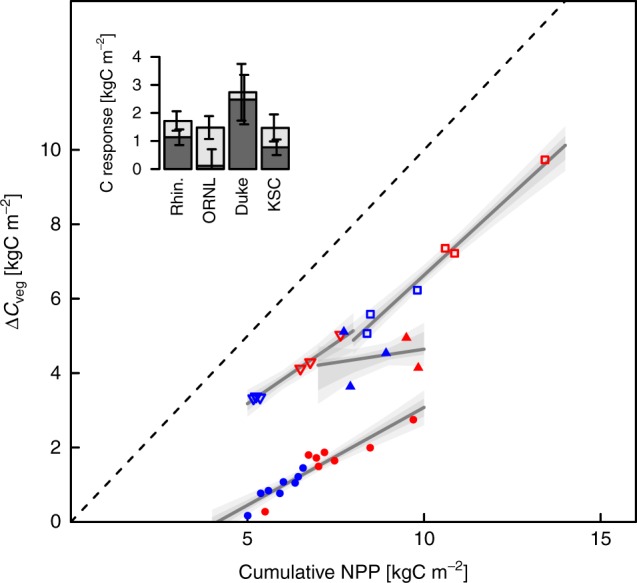
Fig. 2.

The relationship between forest biomass increment (ΔCveg; kgC m−2) and cumulative NPP (cNPP; kgC m−2) over the duration of the experiments. Each point represents an individual sample plot. Ambient plots shown in blue and elevated in red; open triangles, Rhinelander; filled triangles ORNL; open squares, Duke; & filled circles KSC. Note the generally large within-site, within-treatment variability in cNPP. Dark grey lines represent the regression from the best mixed-model (Table 2, Model 3), grey polygons represent the site-specific SEM confidence interval (CI), and the lighter grey polygons represent the 95% CI. Inset: CO2 stimulation of cumulative NPP ± SEM (light grey bars) and forest biomass increment ± SEM (dark grey bars) over the duration of the experiments
