
Figure 2.
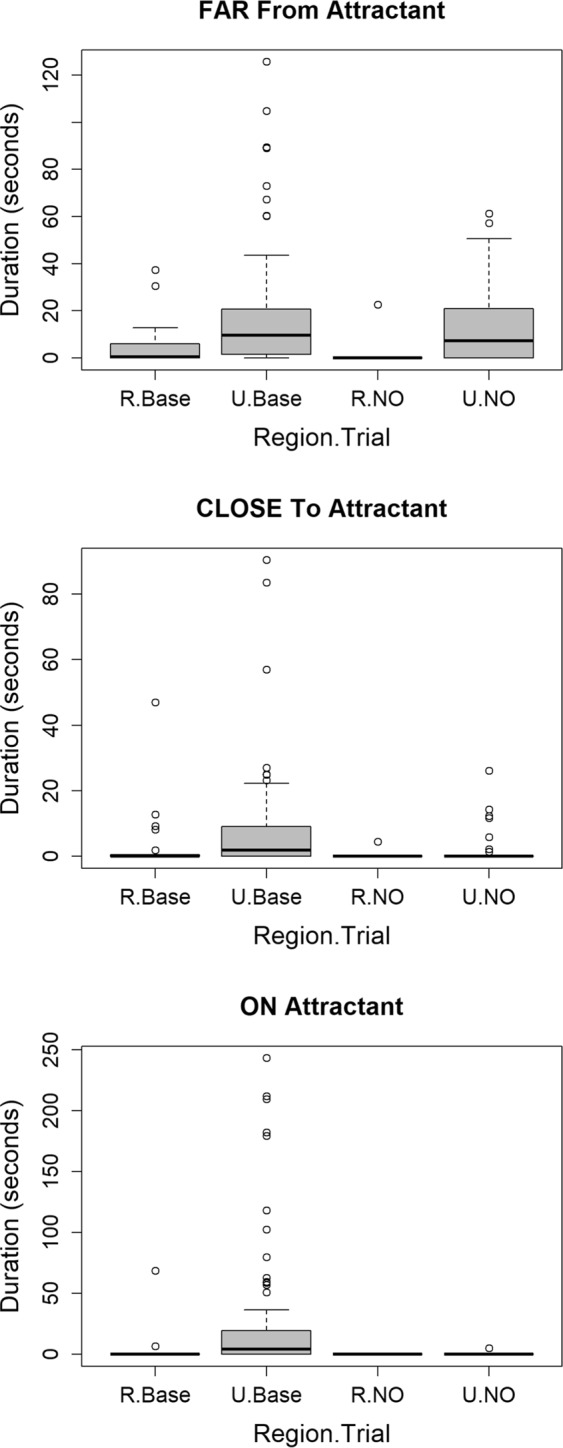
Boxplots [median value = bold horizontal line; 1st and 3rd quartiles = bottom and top of box, respectively; whiskers = the most extreme data point that is no more than 1.5 times the length of the box; and outliers = circles] of the amount of time coyotes in the rural (R) and urban (U) areas (Region) spent at three distances (far, close and on) during the novel objects test at baseline (Base) and treatment (NO) sites (Trial).