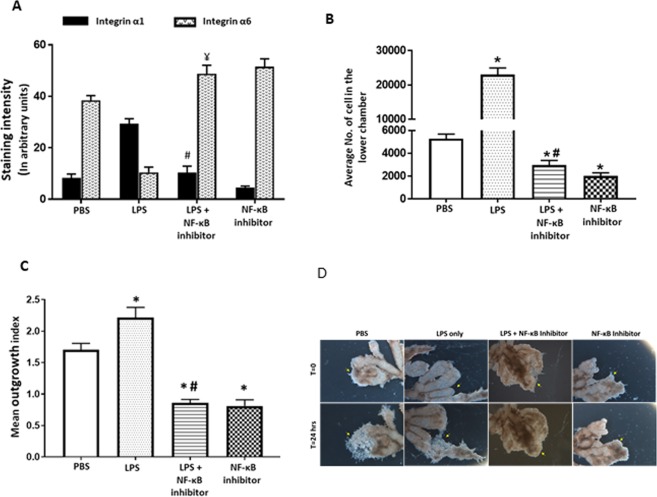
Figure 7.
LPS mediated increase in invasion was prevented by inhibition of NF-κB activity. (A) HTR-8/SVneo cells were stained for assessing the expression of integrins α1 and α6. Graph shows mean staining intensity for α1 and α6 across groups. (B) Graph shows the average number of cells counted in the lower chamber in the matrigel invasion assay with HTR-8/SVneo cells treated with LPS + NF-κB inhibitor. (C) Graph shows mean length of invasion in different groups measured after 24 hrs of treatment showing reduction in LPS induced invasion in presence of NF-κB inhibitor. (D) Representative image showing effects of NF-κB inhibitor on invasion in explant villous clusters with EVT tips. n = 4, ‘*’, ‘ψ’ indicates significance at p < 0.05 when compared to the PBS control group for α1 and α6 respectively, ‘#’, ‘¥’ indicates significance at p < 0.05 when compared to the LPS treated group for α1 and α6 respectively.

