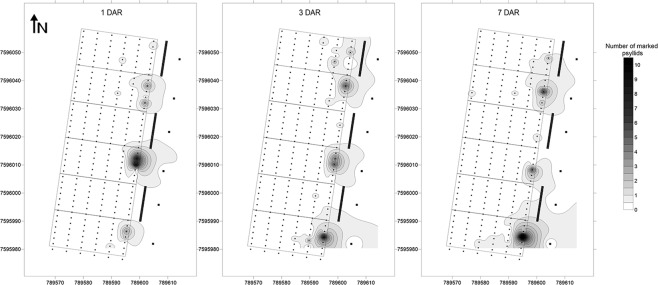
Figure 3.
(Miranda) Diaphorina citri infestation maps at 1, 3 and 7 days after release (DAR). Data were obtained with the sum of psyllids found on citrus trees in the first, second and third replicate of the experiment to assess the effect of orange jasmine as a trap crop on D. citri settlement and dispersal. Each black dot represents a citrus tree. Black squares at the right side of map are the insect release platforms. The three groups of thick black lines represent the orange jasmine trap crop. Numbers at the bottom and left side of map are the Universal Transverse Mercator (UTM) coordinates from 22 k zone.

