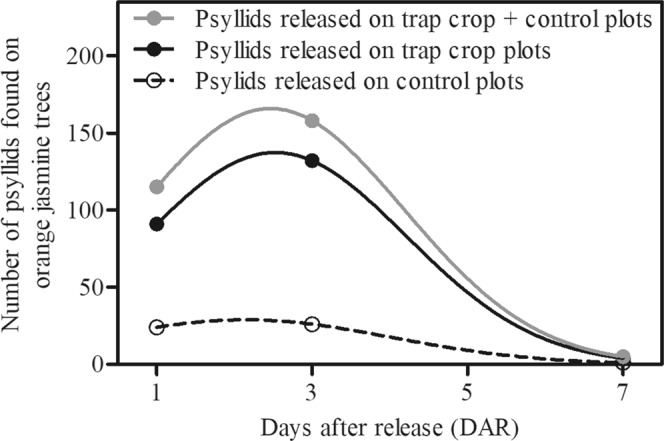
Figure 4.

(Miranda) Number of marked psyllids found on orange jasmine trees according to the plots in which the insects were released: trap crop + control, trap crop and control. Visual assessments were performed at 1, 3 and 7 days after release (DAR). Observed data were fitted to Gaussian models (lines) with the equations y = 165.90 × exp(−0.50 × ((x-2.47)/1.71)2), y = 137.3 × exp(−0.50 × ((x-2.53)/1.68)2), and y = 28.88 × exp(−0.50 × ((x-2.14)/1.87)2) for psyllids released on trap crop + control, trap crop and control plots, respectively.
