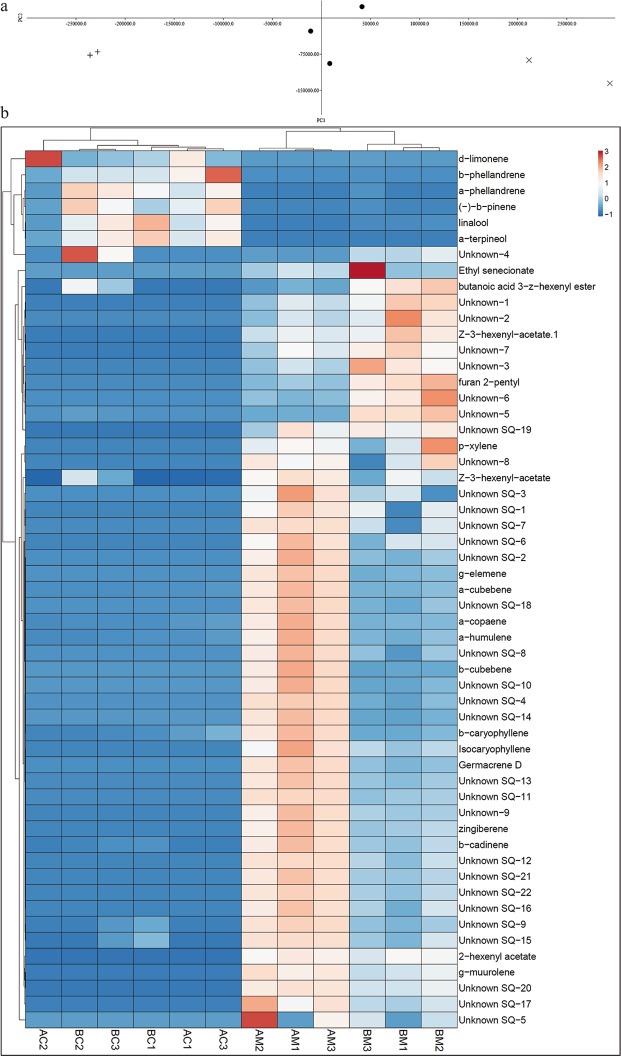
Figure 7.
(Miranda) (a) Representative Principal Component Analysis (PCA) of MetAlign output scan peak values resulting from GC-MS of orange jasmine and sweet orange flushes. + corresponds to orange jasmine, X to orange and dots (•) to quality control samples (mixtures of flushes from both genotypes). PC1 explained at least 75% of the variance at two independent replicate dates. (b) Heatmap, generated with ClustVis, showing the corrected areas of selected volatile compounds emitted by orange jasmine (AM1, AM2, AM3, BM1, BM2, BM3) and sweet orange (AC1, AC2, AC3, BC1, BC2, BC3) flushes. Representation corresponds to three biological replicates (named 1, 2, 3) for each genotype (M, orange jasmine; C, orange) at two different sampling dates (A and B).

