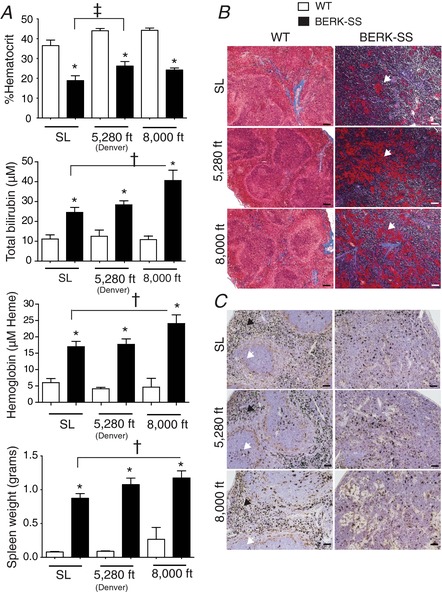
Figure 1. Hematologic responses.

A, top: total %Hct for WT (open bars) and BERK‐SS mice (solid bars). * P < 0.0001 vs. WT. ‡P = 0.011 vs. BERK‐SS + sea level (n = 6–8). A, upper‐middle: total bilirubin for WT (open bars) and BERK‐SS mice (solid bars). * P < 0.001 vs. WT. †P = 0.026 vs. BERK‐SS + sea level (n = 6–8). A, lower‐middle: plasma haemoglobin concentrations for WT (open bars) vs. BERK‐SS mice (solid bars). * P < 0.0001 vs. WT. †P = 0.044 vs. BERK‐SS + sea level (n = 6–8). A, lower‐panel: spleen weights for WT (open bars) and BERK‐SS mice (solid bars). * P < 0.0001 vs. WT. †P = 0.031 vs. BERK‐SS + sea level (n = 6–8). B, Masson's Trichrome and fibrinogen staining of spleens from WT and BERK‐SS mice. White arrows show deposits of fibrinogen in collagen rich regions of the spleen red/white pulp. Magnification 10× (scale bar = 100 μm). C, Perls’ DAB iron staining of spleens from WT and BERK‐SS mice. White arrows show intact structures of the white pulp, whereas dark arrows show intact structure of the red pulp. Magnification 20× (scale bar = 50 μm). [Color figure can be viewed at wileyonlinelibrary.com]
