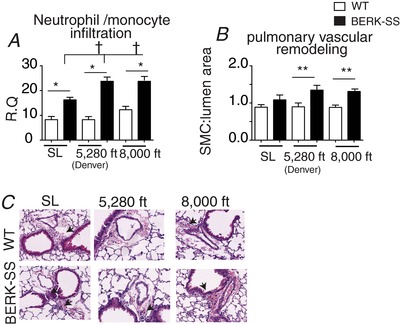
Figure 3. Pulmonary artery remodelling.

A, quantification of neutrophil / monocyte cells surrounding pulmonary arteries. * P < 0.001, BERK‐SS (solid bars) vs. WT mice (open bars). †P < 0.01 (n = 6–8) BERK‐SS (solid bars) housed at Denver and 8000 feet vs. BERK‐SS mice housed at sea level. B, quantification of medial hypertrophy in medium sized vessels (50–100 μm). ** P = 0.03 (n = 6–8) BERK‐SS (solid bars) housed at Denver and 8000 feet vs. WT cohorts (open bars). C, representative microphotographs of medium sized vessel (50 to 100 μm) stained for haemtoxylin and eosin (H&E). [Color figure can be viewed at wileyonlinelibrary.com]
