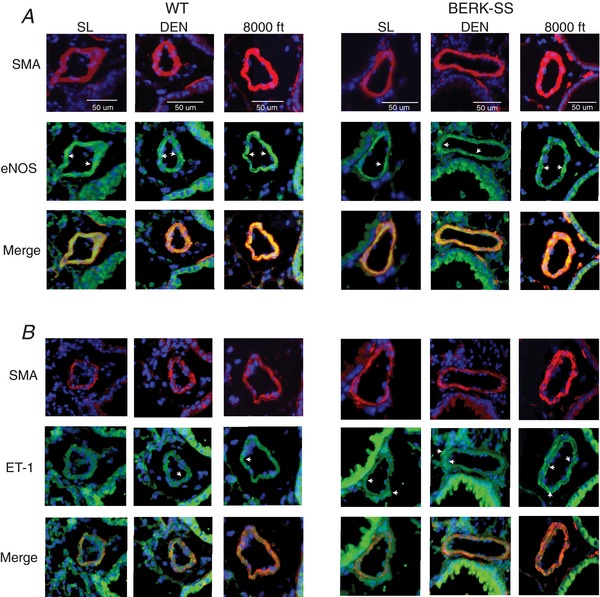
Figure 5. Localization of lung eNOS and ET‐1 expression from a representative animal.

Microphotographs of serial lung sections are from distal pulmonary arteries ∼50 μm in diameter showing (A) eNOS expression and (B) ET‐1 expression in resistant arteries. Images were originally captured at 20×. White arrows show areas of eNOS or ET‐1 expression. Red: smooth muscle actin (SMA). Green: eNOS or ET‐1. Blue: 4′,6‐diamidino‐2‐phenylindole. [Color figure can be viewed at wileyonlinelibrary.com]
