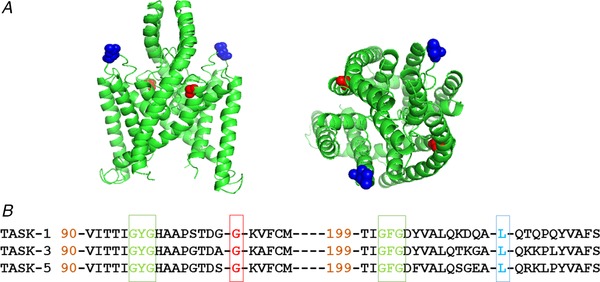
Figure 1. Homology model of TASK‐1 variants.

A, homology model of TASK channels based on TRAAK crystal structure (PDB ID: 3UM7; Brohawn et al. 2012) depicting the location of the two PAH TASK‐1 mutations: G106R and L214R. TASK‐1_G106 amino acids are shown in red and TASK‐1_L214 are shown in blue. Left: side view of the channel. Right: view from above the channel. B, amino acid sequence alignment of TASK‐1 with the two other members of the TASK subfamily: TASK‐3 and TASK‐5. Gaps are indicated by dashes and numbers indicate where sequence begins relative to the full length channel. The amino acids mutated in PAH patients, glycine (G) 106 and leucine (L) 214 are in red and blue, respectively. The selectivity filter regions are shown in green. [Color figure can be viewed at wileyonlinelibrary.com]
