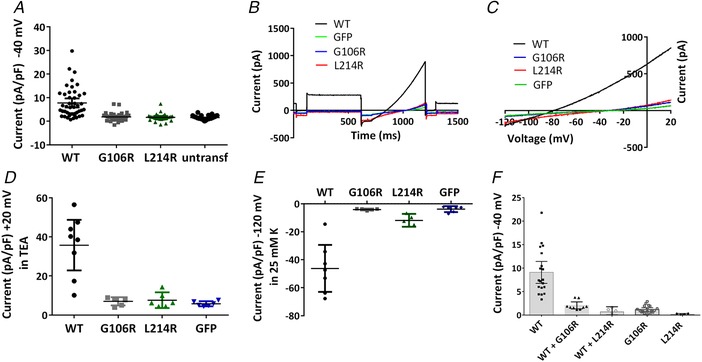
Figure 2. Electrophysiological profiling of currents through WT TASK‐1 and TASK‐1 mutant channels.

A, current density (pA pF–1) measured at –40 mV from individual cells transiently expressing WT TASK‐1, TASK‐1_G106R, TASK‐1_L214R channels or untransfected cells. Error bars represent the 95% CI. B, raw data trace from exemplar human TASK‐1, TASK‐1_G106R, TASK‐1_L214R channels and GFP alone transfected cells in 10 mm TEA using a step‐ramp voltage protocol as detailed in the Methods. C, current–voltage relationship for the cells in (B) evoked by ramp changes in voltage from –120 to –20 mV. D, current density (pA pF–1) measured at +20 mV in the presence of 10 mm TEA for cells expressing WT TASK‐1, TASK‐1_G106R, TASK‐1_L214R channels or GFP alone. E, current density (pA pF–1) measured at –120 mV in 25 mm K external for cells expressing WT TASK‐1, TASK‐1_G106R, TASK‐1_L214R channels or GFP alone. F, current density (pA pF–1) measured at –40 mV for cells expressing WT TASK‐1, TASK‐1_G106R, TASK‐1_L214R channels or co‐expression of WT TASK_1 and TASK‐1_G106R or WT TASK_1 and TASK‐1_L214R. [Color figure can be viewed at wileyonlinelibrary.com]
