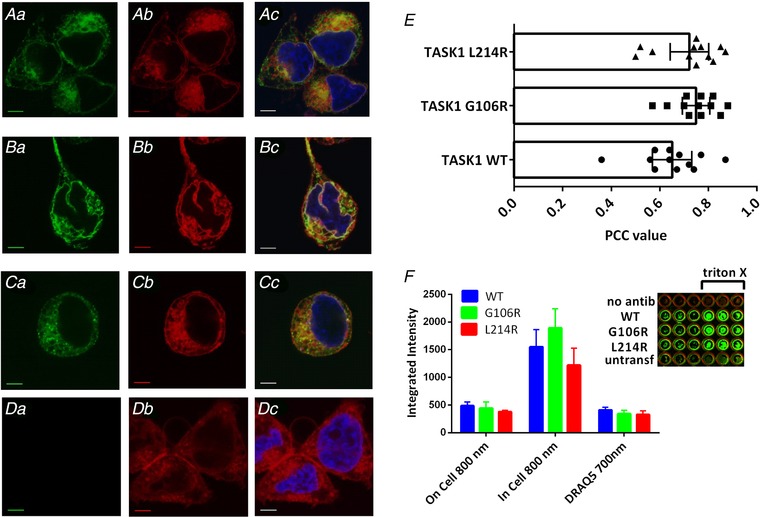
Figure 4. Evaluation of cellular localization of labelled TASK‐1 variants.

Aa and Ab, photomicrograph taken using confocal microscopy showing cellular localization of WT TASK‐1 channels C terminally fused with GFP, relative to the location of the plasma membrane stained with CellMask Deep Red. Ac, overlay of (Aa) and (Ab) indicating co‐localization of TASK‐1‐GFP with the plasma membrane in yellow. Nuclei were stained with the blue fluorescent dye Hoechst 33258. Ba, cellular localization of TASK‐1_G106R fused with GFP, relative to the location of the membrane (Bb). Bc, co‐localization of the G106R variant at the membrane in yellow. Ca, localization of TASK‐1_L214R in relation to the plasma membrane (Cb). Cc, overlap of the GFP‐fused variant with the plasma membrane, stained red. Da, cells untransfected with TASK‐1; (Db) and (Dc) as above. All scale bars are 5 μm. E, quantification of the co‐localization observed in experiments, as shown in (Ac), (Bc) and (Cc), using Pearson's correlation coefficient. A correlation coefficient of 1 represents 100% correlation. F, integrated fluorescence intensity for HA‐tagged WT and mutant TASK‐1 channels in non‐permeabilized (membrane) and permeabilized (whole‐cell) cells detected at 800 nm and for DRAQ5 (whole cell) detected at 700 nm using a Li‐Cor Odyssey SA fluorescence imager. Each column represents the mean ± SEM from three independent experiments performed in triplicate. The mean integrated intensity obtained from untransfected cells on the same plate, treated in the same way, was subtracted from each value. Inset: exemplar coverslips from a single plate, for ‘no antib’ (WT TASK‐1 with no primary antibody), WT TASK‐1, TASK‐1_G106R, TASK‐1_L214 transfected cells and untransfected cells ‘untransf’. Each row has three unpermeabilized coverslips and three permeabilized (with Triton X‐100) coverslips. [Color figure can be viewed at wileyonlinelibrary.com]
